Author Archives: David Snowball

About David Snowball

David Snowball, PhD (Massachusetts). Cofounder, lead writer. David is a Professor of Communication Studies at Augustana College, Rock Island, Illinois, a nationally-recognized college of the liberal arts and sciences, founded in 1860. For a quarter century, David competed in academic debate and coached college debate teams to over 1500 individual victories and 50 tournament championships. When he retired from that research-intensive endeavor, his interest turned to researching fund investing and fund communication strategies. He served as the closing moderator of Brill’s Mutual Funds Interactive (a Forbes “Best of the Web” site), was the Senior Fund Analyst at FundAlarm and author of over 120 fund profiles.

AXS Market Neutral (formerly Cognios Market Neutral), (COGMX), February 2016

By David Snowball

At the time of publication, this fund was named Cognios Market Neutral.

Objective and strategy

The fund seeks long-term growth of capital independent of stock market direction. The managers balance long and short positions in domestic large cap stocks within the S&P 500 universe. They calculate a company’s Return on Tangible Assets (ROTA) and Return on Market Value of Equity (ROME). The former is a measure of a firm’s value; the latter measures its stock valuation. They buy good businesses as measured by ROTA and significantly undervalued firms as measured by ROME. Their short positions are made up of poor businesses that are significantly overvalued. As a risk-management measure and to achieve beta neutrality, their individual short positions are generally a lower dollar amount, but constitute more names than the long portfolio.

Adviser

Cognios Capital LLC. Cognios, headquartered near Kansas City was founded in 2008. It’s an independent quantitative investment management firm that pursues both long-only and hedged strategies. As of December 31, 2015, they had $388 million in assets under management. They manage a hedge fund and accounts for individual and institutional clients as well as the mutual fund. The senior folks at Cognios are deeply involved with charitable organizations in the Kansas City area.

Manager

Jonathan Angrist, Brian Machtley and Francisco Bido. Mr. Angrist, Cognios’s cofounder, president and chief investment officer, has co-managed the fund since its inception. He co-owned and was a portfolio manager at Helzberg Angrist Capital, an alternative asset manager that was the predecessor firm to Cognios. He helped launch, and briefly managed, Buffalo Micro Cap fund. Mr. Machtley, Cognios’ chief operating officer, has co-managed the fund since its inception. Previously, Mr. Machtley served as an associate portfolio manager at a Chicago-based hedge fund manager focused on micro-capitalization equities. Mr. Bido is Cognios’ head of quantitative research. Prior to joining Cognios in 2013, Mr. Bido was a senior quantitative researcher with American Century Investments.

Strategy capacity and closure

At $3 billion, the managers would need to consider closing the fund. The strategy capacity is limited primarily by its short portfolio, which has more numerous but smaller positions than the long portfolio.

Management’s stake in the fund

Messrs. Angrist and Machtley have between $100,000 – 500,000 each in the fund. Mr. Bido has between $10,000 – 50,000.  One of the fund’s trustees has an investment of $10,000 – $50,000 in the fund. The vast majority of the fund’s shares – 98% of investor shares and 64% of institutional ones, as of the last Statement of Additional Information – were owned by the A. Joseph Brandmeyer Trust. Mr. Brandmeyer founded the medical supplies company Enturia and is the father of one of the Cognios founders.

Opening date

31 December 2012

Minimum investment

$1,000 for the investor shares (COGMX) and $100,000 for the institutional shares (COGIX).

Expense ratio

The net expense ratio is 3.88% which includes all the dividend expense on securities sold short, borrowing costs and brokerage expenses totaling 2.18%. The AUM is $20.6 million, as of June 2023. 

Comments

Market neutral funds, mostly, are a waste of time. In general, they invest $1 long in what they consider to be a great stock and $1 short in what they consider to be an awful one. Because there are equal long and short positions, the general movement of the stock market should be neutralized. At that point, the fund’s return is driven by the difference in performance between a great stock and an awful one: if the great stock goes up 10% and the awful one goes up 5%, the fund makes 5%. If the great stock drops 5% and the awful one drops 10%, the fund makes 5%.

Sadly, practice badly lags the theory. The average market neutral fund has made barely 1% annually over the past three and five year periods. On average, they lost money in the turbulent January 2016 with about 60% of the category in the red. Only two market neutral funds have managed to earn 5% or more over the past five years while two others have lost 5% or more. No matter how low you set the bar, the great majority of market neutral funds cannot clear it. In short, they charge hedge fund-like fees for the prospect of cash-like returns.

Why bother?

The short answer is, because we need risk mitigation and our traditional tool for it – investing in bonds – is likely to fail us. Bonds are generating very little income, with interest rates at or near zero there’s very little room for price appreciation (the price of bonds rise when interest rates fall), there are looming questions about liquidity in the bond market and central bankers have few resources left to boost markets.

Fortunately, a few market neutral funds seem to have gotten the discipline right. Cognios is one of them. The fund has returned 7.6% annually over the three years of its existence, while its peers made 1.2%. In January 2016, the fund returned 4.3% while the stock market dropped 5% and its peers lost a fraction of a percent. That record places it in the top 4% of its peer group in the company of two titans: BlackRock and Vanguard.

What has Cognios gotten right?

  1. Their portfolio is beta neutral, rather than dollar neutral. In a typical dollar-neutral portfolio, there’s $1 long for $1 short. That can be a serious problem if the beta characteristics of the short portfolio don’t match those of the long portfolio; a bunch of high beta shorts paired with low beta long positions is a recipe for instability and under-performance. Cognios focuses on keeping the portfolio beta-neutral: if the beta of the short portfolio is high relative to the long, they reduce the size of the short portfolio. That more completely cancels the effects of market movements on the fund’s return.
  2. Their long positions are in high-quality value stocks, rather than growth ones. They use a quantitative screen called ROTA/ROME ™. ROTA (Return on Tangible Assets) is a way of identifying high-quality businesses. At base, it measures a sort of capital efficiency: a company that generates $300 million in returns on a $1 billion in assets is doing better than a company that generates $150 million in returns on those same assets. Cognios research shows ROTA to be a stable identifier of high quality firms; that is, firms that use capital well in one period tend to continue doing so in the future. As Mr. Buffett has said, “A good business is one that earns high return on tangible assets. That’s pretty simple. The very best businesses are the ones that earn a high return on tangible assets and grow.” The combined quality and value screens skew the portfolio toward value. They also only invest in S&P 500 stocks – no use of derivatives, futures or swaps.
  3. They target equity-like returns. Most market neutral managers strive for returns in the low single-digits, to which Mr. Angrist echoes the question: “why bother?” He believes that with a more concentrated portfolio – perhaps 50 long positions and 100 short ones – he’s able to find and exploit enough mispriced securities to generate substantially better returns.
  4. They don’t second-guess their decisions. Their strategy is mechanical and repeatable. They don’t make top-down calls about what sectors are attractive, nor do they worry about the direction of the market, terrorism, interest rates, oil prices or the Chinese banking system. If they’ve managed to neutralize the effect of market movements on the portfolio, they’ve also made fretting about such things irrelevant. So they don’t.
  5. They focus. This is their flagship product and their only mutual fund.

Bottom Line

A market neutral strategy isn’t designed to thrive in a bull market, where even bad companies are assigned ever-rising prices. These funds are designed to serve you in uncertain or falling markets. It’s unclear, with the prospect that both stocks and bonds might be volatile and falling, that traditional strategies will fully protect you. GMO’s December 2015 asset class returns suggest that a traditional 60/40 hybrid fund will lose 1.4% annually in real terms over the next five to seven years. Of the three market neutral funds with the best records (Vanguard Market Neutral VMNFX with a $250,000 minimum and BlackRock Event Driven Equity BALPX with a 5.75% load are the other two), Cognios is by far the smallest, most accessible and most interesting. You might want to learn more about it.

Fund website

AXS Market Neutral Fund

[cr2016]

RiverNorth Opportunities Fund, Inc. (RIV), February 2016

By David Snowball

Objective and strategy

The Fund’s investment objective is total return consisting of capital appreciation and current income. Like the open-end RiverNorth Core Opportunity Fund (RNCOX), this fund invests opportunistically in a changing mix of closed-end funds including business development companies and ETFs. In the normal course of events, at least 65% of the fund’s assets will be in CEFs.  RiverNorth will implement an opportunistic strategy designed to capitalize on the inefficiencies in the CEF space while simultaneously providing diversified exposure to several asset classes. The prospectus articulates a long series of investment guidelines:

  • Up to 80% of the fund might be invested in equity funds
  • No more than 30% will be invested in global equity funds
  • No more than 15% will be in emerging markets equities
  • Up to 60% might be invested in fixed income funds
  • No more than 30% in high yield bonds or senior loans
  • No more than 15% in emerging market income
  • No more than 15% in real estate
  • No more than 15% in energy MLPs
  • No more than 10% in new CEFs
  • No investments in leveraged or inverse CEFs
  • Up to 30% of the portfolio can be short positions in ETFs, a strategy that will be used defensively.
  • Fund leverage is limited to 15% with look-through leverage (that is, factoring in leverage that might be use in the funds they invest in) limited to 33%.

Adviser

ALPS Advisors, Inc.

Sub-Adviser

RiverNorth Capital Management, LLC. RiverNorth is an investment managementfirm founded in 2000 that specializes in opportunistic strategies in niche markets where the potential to exploit inefficiencies is greatest. RiverNorth is the sub-adviser to RiverNorth Opportunities Fund, Inc. RiverNorth also advises three limited partnerships and the four RiverNorth Funds: RiverNorth Core Opportunity (RNCOX), RiverNorth/Oaktree High Income (RNOTX), Equity Opportunity (RNEOX), RiverNorth/DoubleLine Strategic Income (RNDLX) and this one. As of December 31, 2015, they managed $3.3 billion.

Managers

Patrick Galley and Stephen O’Neill. Mr. Galley is RiverNorth’s Chief Investment Officer and President and Chairman of RiverNorth Funds. He also manages all or parts of seven strategies with Mr. O’Neill. Before joining RiverNorth in 2004, he was a Vice President at Bank of America in the Global Investment Bank’s Portfolio Management group. Mr. O’Neill co-manages the firm’s closed-end fund strategies and helps to oversee the closed-end fund investment team. Prior to joining RiverNorth in 2007, he was an Assistant Vice President at Bank of America in the Global Investment Bank’s Portfolio Management group.

Strategy capacity and closure

The Fund is a fixed pool of assets now that the IPO is complete, which means there are no issues with capacity going forward.

Management’s stake in the fund

Messrs. Galley and O’Neill each have between $100,000 – 500,000 in the fund. Three of the four independent trustees have relatively modest ($10,000-100,000) investments in the open-end version of the fund while one has no investments with RiverNorth. RiverNorth, “its affiliates and employees anticipate beneficially owning, as a group, approximately $10 million in shares of the Fund.” Mr. Galley also owns more than 25% of RiverNorth Holding Company, the adviser’s parent company.

Opening date

December 23, 2015

Minimum investment

Like stocks and ETFs, there is no minimum purchase established by the fund though you will need to pay a brokerage fee.

Expense ratio

Total annual expense ratio as a percentage of net assets attributable to common shares as of July 31, 2022, is 1.58% (excluding dividend expense and line of credit expense). Including dividend expense and line of credit expense, the expense ratio is 1.91%. 

The total net assets are $262.1 million and the total managed assets are $359.9 million, according to the Q2 2023 fact sheet. 

Comments

The pricing of closed-end fund shares is famously irrational. Like a “normal” mutual fund, closed-end funds calculate daily net asset values by taking the value of all of the securities they own – an unambiguous figure based on the publicly-quoted prices for stocks – and divide it by the number of shares they’ve issued, another unambiguous figure. At the end of each day, a fund can say, with considerable confidence, “one share of our fund is worth $10.”

So, why can you buy that share for $9.60? Or $9.00 or $8.37? Or, as in the case of Boulder Growth & Income (BIF), $7.56?

The short answer is: people are nuts. CEFs trade like stocks throughout the day and, at any given moment, one share is worth precisely what you convince somebody to pay for that one share. When investors get panicked, people want to dump their shares. If they’re sufficiently panicked they’ll sell at a loss, accepting dimes on the dollar just to be free again. To be clear: during a panic, you can often buy $10 worth of securities for $8. If you simply hold those shares until the panic subsidies, you might reasonably expect to sell them for $9 or $9.50. Even if the market is falling, when the panic selling passes, the discounts contract and you might pocket market-neutral arbitrage gains of 10 or 20%.

It’s a fascinating game, but one which very few of us can successfully play. There are two reasons for that:

  1. You need to know a ridiculous lot about every potential CEF investment: not just current discount but its typical discount, its price movement history, its maximum discount but also the structural factors that might make its current discount continue or deepen.
  2. You need to know when to move and you need to be ready to: remember, these discounts are at their greatest during panics. Just as the market collapses and it appears the world really is ending this time, you need to reach for your checkbook. The discounts are evidence that normal investors do the exact opposite: the desire to escape leads us to sell for the sake of selling.

RiverNorth’s primary expertise is CEF investing; in particular, in investing opportunistically when things look their worst. That strategy is primarily manifested in RiverNorth Core Opportunity (RNCOX), an open-ended tactical allocation fund that uses this strategy. This long-awaited fund embodies the same strategy with a couple twists: it can make modest use of leverage and it’s more devoted to CEFs than is RNCOX. RIV will have at least 65% in CEFs while RNCOX might average 50-70%.

And, too, RIV itself can sell at a discount. A sophisticated investor might monitor the fund and find herself able to buy RIV at a 10% discount at the very moment that RIV is buying other funds at a 20% discount. That would translate to the opportunity to buy $10 worth of stock for $7.20.

Investing in RIV carries clearly demonstrable risks:

  1. It costs a lot. The fund invests in, and passes costs through from, an expensive asset class. The aforementioned Boulder Growth & Income fund charges 1.83%, if RiverNorth buys it, that expense gets passed through to its shareholders as a normal cost of the strategy. The adviser estimates that the fund’s current expenses, assuming they’re using the leverage available to them and including the acquired fund fees and expenses, is 3.72%.
  2. It’s apt to be extremely volatile at times. Put bluntly, the strategy here is to catch falling knives. Ideally you catch them when they don’t have much farther to fall but there’s no guarantee of that.
  3. Its Morningstar rating will periodically suck. If CEF discounts widen after the fund acquires shares, those widened discounts reduce RiverNorth’s return and increase its volatility. Persistently high discounts will make for persistently low Morningstar ratings, which is what we see with RNCOX right now.

That said, this fund is apt to deliver on its promises. The CEF structure, which frees the managers from needing to worry about redemptions or hot money flows, seems well-suited for the mission.

Bottom Line

CEF discounts are now the greatest they’ve been since the depth of the 2008 market meltdown. By RiverNorth’s calculation, discounts are greater now than they’ve been 99% of the time. If panic subsidies, that will provide a substantial tailwind to boost returns for RiverNorth’s shareholders. If the panic persists just long enough for investors to buy RIV at a discount, as the managers are apt to, then the potential gains are multiplied. Investors interested in a more-complete picture of the strategy might want to read our November 2015 profile of RiverNorth Core Opportunity.

Fund website

RiverNorth Opportunities Fund

Fact Sheet

[cr2016]

Leuthold Core Investment (LCORX), February 2016

By David Snowball

Objective and strategy

Leuthold Core pursues capital appreciation and income through the use of tactical asset allocation. Their objective is to avoid significant loss of capital and deliver positive absolute returns while assuming lower risk exposure and lower relative volatility than the S&P 500. Assets are allocated among stocks and ADRs, corporate and government bonds, REITs, commodities, an equity hedge and cash. At one time, the fund’s commodity exposure included direct ownership of physical commodities. Portfolio asset class weightings change as conditions do; exposure is driven by models that determine each asset class’s relative and absolute attractiveness. Equity and fixed-income exposure each range from 30-70% of the portfolio. At the end of 2013, equities comprised 67% of the portfolio. At the end of 2015, 55% of the portfolio was invested in “long” equity positions and 17% was short, for a net exposure under 40%.

Adviser

Leuthold Weeden Capital Management (LWCM). The Leuthold Group began in 1981 as an institutional investment research firm. Their quantitative analyses eventually came to track several hundred factors, some with data dating back to the Great Depression. In 1987, they founded LWCM to direct investment portfolios using the firm’s financial analyses. They manage $1.6 billion through five mutual funds, separate accounts and limited partnerships.

Manager

Doug Ramsey, Chun Wang, Jun Zhu and Greg Swenson. Mr. Ramsey joined Leuthold in 2005 and is their chief investment officer. Mr. Swenson joined Leuthold in 2006 from FactSet Research. Ms. Zhu came to Leuthold in 2008 after earning an MBA from the Applied Security Analysis Program at the University of Wisconsin-Madison. While there, she co-managed a $60 million university endowment fund run by students at the program. Mr. Wang joined in 2009 after a stint with a Hong Kong-based hedge fund and serving as director of research for Ned Davis Research. Collectively the team shares responsibility for testing and refining the firm’s quantitative models and for managing four of their five funds, Grizzly Short (GRZZX) excepted.

Strategy capacity and closure

About $5 billion. Core was hard-closed in 2006 when it reached $2 billion in assets. That decision was driven by limits imposed by the manager’s ability to take a meaningful position in the smallest of the 155 industry groups (e.g. industrial gases) that they then targeted. Following Steve Leuthold’s retirement to lovely Bar Harbor, Maine, the managers studied and implemented a couple refinements to the strategy (somewhat fewer but larger industry groups, somewhat less concentration) that gave the strategy a bit more capacity.

Management’s stake in the fund

Three of the fund’s four managers have investments in the fund, ranging from Mr. Swenson’s $50,000 – 100,000 on the low end to Mr. Ramsey at over $1 million on the high end. All four of the fund’s trustees have substantial investments either directly in the fund or in a separately-managed account whose strategy mirrors the fund’s.

Opening date

November 20, 1995.

Minimum investment

$10,000, reduced to $1,000 for IRAs. The minimum for the institutional share class (LCRIX) is $1,000,000.

Expense ratio

1.16% on assets of $871 million, as of January 2016.

Comments

Leuthold Core Investment was the original tactical asset allocation fund. While other, older funds changed their traditional investment strategies to become tactical allocation funds when they came in vogue three or four years ago, Leuthold Core has pursued the same discipline for two decades.

Core exemplifies their corporate philosophy: “Our definition of long-term investment success is making money . . . and keeping it.”

It does both of those things. Here’s how:

Leuthold’s asset allocation funds construct their portfolios in two steps: (1) asset allocation and (2) security selection. They start by establishing a risk/return profile for the bond market and establishing the probability that stocks will perform better. That judgment draws on Leuthold’s vast experience with statistical analysis of the market and the underlying economies. Their “Major Trends Index,” for example, tracks over 100 variables. This judgment leads them to set the extent of stock exposure. Security selection is then driven by one of two strategies: by an assessment of attractive industries or of individually attractive stocks.

Core focuses on industry selection and its equity portfolio is mirrored in Leuthold Select Industries. Leuthold uses its quantitative screens to run through over 115 industry-specific groups composed of narrow themes, such as Airlines, Health Care Facilities, and Semiconductors to establish the most attractive of them. Core and Select Industries then invest in the most attractive of the attractive sectors. Mr. Ramsey notes that they’ll only consider investing in the most attractive 20% of industries; currently they have positions in 16 or 17 of them. Within the groups, they target attractively priced, financially sound industry leaders. Mr. Ramsay’s description is that they function as “value investors within growth groups.” They short the least attractive stocks in the least attractive industries.

Why should you care? Leuthold believes that it adds value primarily through the strength of its asset allocation and industry selection decisions. By shifting between asset classes and shorting portions of the market, it has helped investors dodge the worst of the market’s downturns. Here’s a simple comparison of Core’s risk and return performance since inception, benchmarked against the all-equity S&P 500.

  APR MaxDD Months Recover Std Dev Downside Dev Ulcer Index Bear Dev Sharpe Ratio Sortino Ratio Martin Ratio
Good if … Higher Lower Lower Lower Lower Lower Lower Higher Higher Higher
Leuthold Core 8.4 -36.5 35 11.0 7.5 8.9 6.8 0.55 0.81 0.68
S&P 500 Monthly Reinvested Index 8.2 -50.9 53 15.3 10.7 17.5 10.3 0.38 0.55 0.34
Leuthold: check check check check check check check check check check

Over time, Core has had slightly higher returns and substantially lower volatility than has the stock market. Morningstar and Lipper have, of course, different peer groups (Tactical Allocation and Flexible Portfolio, respectively) for Core. It has handily beaten both. Core’s returns are in the top 10% of its Morningstar peer groups for the past 1, 3, 5, 10 and 15 year periods.

Our Lipper data does not allow us to establish Leuthold’s percentile rank against its peer group but does show a strikingly consistent picture of higher upside and lower downside than our “flexible portfolio” funds. In the table below, Cycle 4 is the period from the dot-com crash to the start of the ’08 market crisis while Cycle 5 is from the start of the market crisis to the end of 2015. The 20-year report is the same as the “since inception” would be.

  Time period Flexible Portfolio Leuthold Core Leuthold
Annualized Percent Return 20 Year 7.1 8.4 check
10 Year 4.9 5.3 check
5 Year 4.1 5.6 check
3 Year 3.3 8.6 check
1 Year -5.2 -1.0 check
Cycle 4 7.3 11.9 check
Cycle 5 2.8 3.1 check
Maximum Drawdown 20 Year -38.6 -36.5 check
10 Year -36.5 -36.5 check
5 Year -14.9 -15.4 check
3 Year -11.1 -3.7 check
1 Year -9.4 -3.2 check
Cycle 4 -23.8 -21.8 check
Cycle 5 -36.9 -36.5 check
Recovery Time, in months 20 Year 50 35 check
10 Year 43 35 check
5 Year 18 23 X
3 Year 12 4 check
1 Year 8 7 check
Cycle 4 39 26 check
Cycle 5 43 35 check
Standard Deviation 20 Year 11.9 11.0 check
10 Year 11.7 12.0 X
5 Year 9.3 8.5 check
3 Year 8.1 7.0 check
1 Year 8.7 4.9 check
Cycle 4 9.9 10.4 X
Cycle 5 12.7 12.9 X

Modestly higher short-term volatility is possible but, in general, more upside and less downside than other similarly active funds. And, too, Leuthold costs a lot less: 1.16% with Leuthold rather than 1.42% for its Morningstar peers.

Bottom Line

At the Observer, we’re always concerned about the state of the market because we know that investors are much less risk tolerant than they think they are. The years ahead seem particularly fraught to us. Lots of managers, some utterly untested, promise to help you adjust to quickly shifting conditions. Leuthold has delivered on such promises more consistently, with more discipline, for a longer period than virtually any competitor. Investors who perceive that storms are coming, but who don’t have the time or resources to make frequent adjustments to their portfolios, should add Leuthold Core to their due-diligence list.

Investors who are impressed with Core’s discipline but would like a higher degree of international exposure should investigate Leuthold Global (GLBLX). Global applies the same discipline as Core, but starts with a universe of 5000 global stocks rather than 3000 domestic-plus-ADRs one.

Fund website

Leuthold Core Investment Fund

[cr2016]

January 1, 2016

By David Snowball

Dear friends,

grinchTalk about sturm und drang. After 75 days with in which the stock market rose or fell by 1% or more, the Vanguard Total Stock Market Index managed to roar ahead to a gain … of 0.29%. Almost 3000 mutual funds hung within two percentage points, up or down, of zero. Ten managed the rare feat of returning precisely zero. Far from a Santa Claus rally, 2015 couldn’t even manage a Grinchy Claus one.

And the Steelers lost to the Ravens. Again! Just rip my heart out, why doncha?

Annus horribilis or annus mediocris?

In all likelihood, the following three statements described your investment portfolio: your manager lost money, you suspect he’s lost touch with the market, and you’re confused.

Welcome to the club! 2015 saw incredibly widespread disappointment for investors. Investors saw losses in:

  • 8 of 9 domestic equity categories, excluding large growth
  • 17 of 17 asset allocation categories, from retirement income to tactical allocation
  • 8 of 15 international stock categories
  • 14 of 15 taxable bond categories and
  • 6 of 6 alternative or hedged fund categories.

Anything that smacked of “real assets” (energy, MLPs, natural resources) or Latin America posted 20-30% declines. Foreign and domestic value strategies, regardless of market cap, trailed their growth-oriented peers by 400-700 basis points. The average hedge fund finished the year down about 4% and Warren Buffett’s Berkshire-Hathaway dropped 11.5%. The Masters of the Universe – William Ackman, David Einhorn, Joel Greenblatt, and Larry Robbins among them – are all spending their holidays penning letters that explain why 10-25% losses are no big deal. The folks at Bain, Fortress Investments and BlackRock spared themselves the bother by simply closing their hedge funds this year.

And among funds I actually care about (a/k/a “own”), T. Rowe Price Spectrum Income (RPSIX) lost money for just the third time in its 25 year history. As in 1994, it’s posting an annual loss of about 2%.

What to make of it? Opinions differ. Neil Irwin, writing in The New York Times half-celebrated:

Name a financial asset — any financial asset. How did it do in 2015?

The answer, in all likelihood: Meh.

It might have made a little money. It might have lost a little money. But, barring any drastic moves in the final trading days of 2015, the most widely held classes of assets, including stocks and bonds across the globe, were basically flat … While that may be disappointing news for people who hoped to see big returns from at least some portion of their portfolio, it is excellent news for anyone who wants to see a steady global economic expansion without new bubbles and all the volatility that can bring. (“Financial markets were flat in 2015. Thank goodness.” 12/30/2015)

Stephanie Yang, writing for CNBC, half-despaired:

It’s been a really, really tough year for returns.

According to data from Societe Generale, the best-performing asset class of 2015 has been stocks, whose meager 2 percent total return (that is, including dividends) still surpasses those of long-term bonds, short-term Treasury bills and commodities. These minimal gains make 2015 the worst year for finding returns since 1937, when the cash-like 3-month Treasury bill beat out other major asset classes with a return of 0.3 percent. (“2015 was the hardest year to make money in 78 years,” 12/31/2015).

Thirty-one liquid alts funds subsequently liquidated, the most ever (“The Year the Hedge-Fund Model Stalled on Main Street,” WSJ, 12/31/2015).

timeline of the top

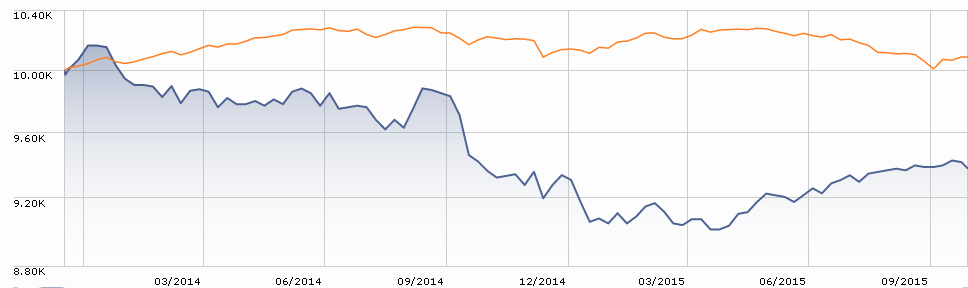
Courtesy of Leuthold Group

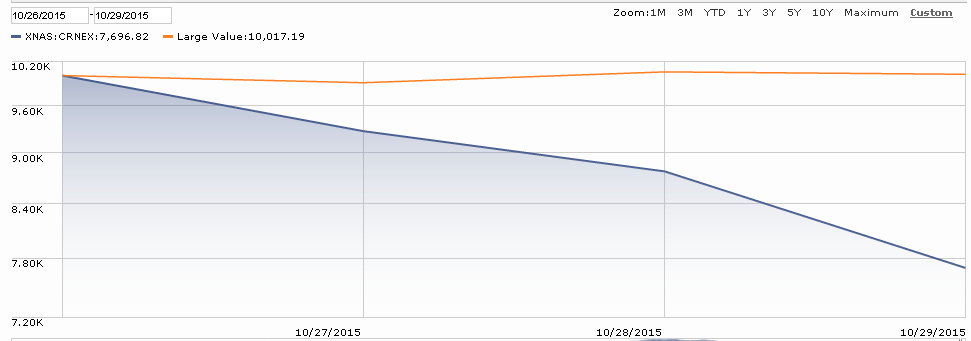
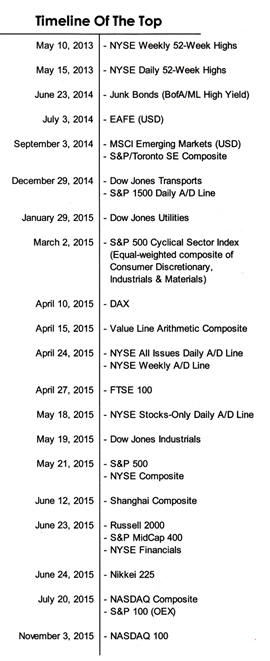
The most pressing question is whether 2015 is a single bad year or the prelude to something more painful than “more or less flat.” The folks at the Leuthold Group, advisers to the Leuthold funds as well as good institutional researchers, make the argument that the global equity markets have topped out. In support of that position, they break the market out into both component parts (MSCI Emerging Markets or FTSE 100) and internal measures (number of new 52-week highs in the NYSE or the ratio of advancing to declining stocks). With Leuthold’s permission, we’ve reproduced their timeline here.

Two things stand out. First, it appears that “the market’s” gains, if any, are being driven by fewer and fewer stocks. That’s suggested by the fact the number of 52-week highs peaked in 2013 and the number of advancing stocks peaked in spring 2015. The equal-weight version of the S&P 500 (represented by the Guggenheim S&P 500 Equal Weight ETF RSP) trailed the cap-weighted version by 370 basis points. The Value Line Arithmetic Index, which tracks the performance of “the average stock” by equally weighting 1675 issues, is down 11% from its April peak. Nearly 300 of the S&P 500 stocks will likely finish the year in the red. Second, many of the components followed the same pattern: peak in June, crash in August, partially rally in September then fade. The battle cry “there’s always a bull market somewhere!” seems not to be playing out just now.

The S&P 500 began 2015 at 2058. The consensus of market strategists in Barron’s was that it would finish 2015 just north of 2200. It actually ended at 2043. The new consensus is that it will finish 2016 just north of 2200.

The Leuthold Group calculates that, if we were to experience a typical bear market over the next year, the S&P 500 would drop to somewhere between 1500-1600.

By most measures, US stocks remain overpriced. There’s not much margin for safety in the bond market right now with US interest rates near zero and other major developing markets cutting theirs. Those interest rate cuts reflect concerns about weak growth and the potential for a China-led recession. The implosion of Third Avenue Focused Credit (TFCVX) serves as a reminder that liquidity challenges remain unresolved ahead of potentially disruptive regulations contemplated by the SEC.

phil esterhausThe path forward is not particularly clear to me because we’ve never managed such a long period of global economic weakness and zero to negative interest rates before. My plan is to remind myself that I need to care about 2026 more than about 2016, to rebalance soon, and to stick with my discipline which is, roughly put, “invest regularly and automatically in sensible funds that execute a reasonable plan, ignore the market and pay attention to the moments, hours and days that life presents me.” On whole, an hour goofing around with my son or the laughter of dinner guests really does make a much bigger difference in my life than anything my portfolio might do today.

As Sergeant Phil Esterhaus used to remind the guys at Hill Street station as they were preparing to leave on patrol, “Hey, let’s be careful out there.”

For those seeking rather more direct guidance, our colleague Leigh Walzer of Trapezoid offers guidance, below, on the discipline of finding all-weather managers. Helpfully enough, he names a couple for you.

Good-Bye to All That

I cribbed the title from Robert Graves’ 1929 autobiography, one of a host of works detailing the horrors of fighting the Great War and the British military’s almost-criminal incompetence.

We bid farewell, sometimes with sadness, to a host of friends and funds.

Farewell to the Whitebox Funds

The Whitebox Advisors come from The Land of Giants. From the outside, I could never tell whether their expression was “swagger” or “sneer” but I found neither attractive. Back in 2012 readers urged us to look into the funds, and so we did. Our first take was this:

There are some funds, and some management teams, that I find immediately compelling.  Others not.

So far, this is a “not.”

Here’s the argument in favor of Whitebox: they have a Multi-Strategy hedge fund which uses some of the same strategies and which, per a vaguely fawning article in Barron’s, returned 15% annually over the past decade while the S&P returned 5%. I’ll note that the hedge fund’s record does not get reported in the mutual fund’s, which the SEC allows when it believes that the mutual fund replicates the hedge. 

Here’s the reservation: their writing makes them sound arrogant and obscure.  They advertise “a proprietary, multi-factor quantitative model to identify dislocations within and between equity and credit markets.”  At base, they’re looking for irrational price drops.  They also use broad investment themes (they like US blue chips, large cap financials and natural gas producers), are short both the Russell 2000 (which is up 14.2% through 9/28) and individual small cap stocks, and declare that “the dominant theories about how markets behave and the sources of investment success are untrue.”  They don’t believe in the efficient market hypothesis (join the club).

I’ll try to learn more in the month ahead, but I’ll first need to overcome a vague distaste.

I failed to overcome it. The fact that their own managers largely avoided the funds did not engender confidence.

whitebox managers

In the face of poor performance and shrinking assets, they announced the closure of their three liquid alts funds in December. My colleague Charles offers a bit of further reflection on the closure, below.

Farewell to The House of Whitman

Marty Whitman become a fund manager at age 60 and earned enormous respect for his outspokenness and fiercely independent style. Returns at Third Avenue Value Fund (TAVFX) were sometimes great, sometimes awful but always Marty. Somewhere along the way, he elevated David Barse to handle all the business stuff that he had no earthly interest in, got bought by AMG, promised to assemble at least $25 billion in assets and built a set of funds that, save perhaps Third Avenue Real Estate Value (TAREX), never quite matched the original. It’s likely that his ability to judge people, or perhaps the attention he was willing to give to judging them, matched his securities analysis. The firm suffered and Mr. Whitman, in his 80s, either drifted or was pushed aside. Last February we wrote:

In sum, the firm’s five mutual funds are down by $11 billion from their peak asset levels and nearly 50% of the investment professionals on staff five years ago, including the managers of four funds, are gone. At the same time, only one of the five funds has had performance that meets the firm’s long-held standards of excellence.

Many outsiders noted not just the departure of long-tenured members of the Third Avenue community, but also the tendency to replace some those folks with outsiders … Industry professionals we talked with spoke of “a rolling coup,” the intentional marginalization of Mr. Whitman within the firm he created and the influx of outsiders. Understandably, the folks at Third Avenue reject that characterization.

Mr. Barse was, reportedly, furious about our story. An outstanding bit of reporting by Gregory Zuckerman and Matt Wirz from The Wall Street Journal in the wake of the collapse of Third Avenue Focused Credit revealed that “furious” was a more-or-less constant state for him.

Mr. Barse also harangued other fund managers who grew disgruntled. Mr. Whitman took no public steps to rein in the CEO, the people said, preferring to focus on investing.

The dispute boiled over in the fall of 2011, when about 50 employees gathered in the firm’s largest conference room after an annual meeting with investors. Mr. Barse screamed at Mr. Whitman, inches from his face, demanding better performance, according to people who were in the room.

Mr. Whitman “was pounding the table so hard with his fist it was shaking,” said another person at the meeting. Mr. Whitman eventually withdrew money from the Value Fund and quit running it to focus on investing for himself, while remaining chairman of the firm.

As most of Third Avenue’s funds underperformed relevant benchmarks … Mr. Barse seemed to become more irritated, the people said.

Staff stopped using the conference room adjoining Mr. Barse’s office because sometimes he could be heard shouting through the walls.

Most employees received part of their pay on a deferred basis. After 2008, Mr. Barse began personally determining compensation for most personnel, often without explaining his decision, one of the people said. (“How the Third Avenue Fund Melted Down,” 12/23/2015).

Yikes. The Focused Credit fund, Mr. Barse’s brainchild, came into the summer of 2015 with something like one third of its assets invested in illiquid securities, so-called “Level 3 securities.” There are two things you need to know about illiquid securities: you probably can’t sell them (at least not easily or quickly) and you probably can’t know what they’re actually worth (which is defined as “what someone is willing to buy it for”). A well-documented panic ensued when it looked like Focused Credit would need to hurriedly sell securities for which there were no buyers. Mr. Barse ordered the fund’s assets moved to a “liquidating trust,” which meant that shareholders (a) no longer knew what their accounts were worth and (b) no longer could get to the money. The plan, Third Avenue writes, is to liquidate the illiquid securities whenever they find someone willing to pay a decent price for them. Investors will receive dribs and drabs as that process unfolds.

We wrote Third Avenue to ask whether the firm would honor the last-published NAV for their fund and whether the firm had a commitment to “making whole” their investors. Like The Wall Street Journal reporters, we found that folks were unwilling to talk.

And so now investors wait. How long might they wait? Oh, could be eight or ten years. The closest analogue we have is the 2006 blowup of the Amaranth Advisors hedge fund. Amaranth announced that they’d freeze redemptions for two months. That’s now stretched to ten years with the freeze extended until at least December 2016. (“Ten Years After Blowup, Amaranth Investors Waiting to Get Money Back,” WSJ, 12/30/2015). In the interim, it’s hard to understand why investment advisors wouldn’t follow Mr. Whitman out the door.

Farewell to Mainstay Marketfield

Marketfield (MFLDX) was an excellent small no-load liquid alts fund that aspired to be more. It aspired to be a massive liquid alts fund, a goal achieved by selling themselves to New York Life and becoming Mainstay Marketfield. New York Life adopted a $1.7 billion overachiever in 2012 and managed to jam another $20 billion in assets into the fund in two years. The fund hasn’t been the same since. Over the past three years, it’s earned a one-star rating from Morningstar and lost almost 90% of its assets while trailing 90% of its peers.

On December 15, 2015, Mainstay announced an impending divorce:

At a meeting held on December 8-10, 2015, the Board of Trustees of MainStay Funds Trust approved an Agreement and Plan of Reorganization [which] provides for the reorganization of the Fund into the Marketfield Fund (the “New Fund”) …

Prior to the Reorganization, which is expected to occur on or about March 23, 2016, Marketfield Asset Management, LLC, the Fund’s current subadvisor, will continue to manage the Fund … The New Fund will have the same investment objective, principal investment strategies and investment process.

There are very few instances of a fund recovering from such a dramatic fall, but we wish Mr. Aronstein and his remaining investors the very best.

Farewell to Sequoia’s mystique

The fact that Sequoia (SEQUX) lost money in 2015 should bother no one. The fact that they lost their independence should bother anyone who cares about the industry. Sequoia staked its fate to the performance of Valeant Pharmaceuticals, a firm adored by hedge fund managers and Sequoia – which plowed over a third of its portfolio into the stock – for its singular strategy: buy small drug companies with successful niche medicines, then skyrocket the price of those drugs. One recent story reported:

The drugstore price of a tube of Targretin gel, a topical treatment for cutaneous T cell lymphoma, rose to about $30,320 this year from $1,687 in 2009. Most of that increase appears to have occurred after Valeant acquired the drug early in 2013. A patient might need two tubes a month for several months, Dr. Rosenberg said.

The retail price of a tube of Carac cream, used to treat precancerous skin lesions called actinic keratoses, rose to $2,865 this summer from $159 in 2009. Virtually all of the increase occurred after 2011, when Valeant acquired the product. (“Two Valeant drugs lead steep price increases,” 11/25/2015)

Remember that Valeant didn’t do anything to discover or create the drugs; they simply gain control of them and increase the price by 1800%.

Sequoia’s relationship to Valeant’s CEO struck me as deeply troubling: Valeant’s CEO Michael Pearson was consistently “Mike” when Sequoia talked about him, as in “my buddy Mike.”

We met with Mike a few weeks ago and he was telling us how with $300 million, you can get an awful lot done.

Mike can get a lot done with very little.

Mike is making a big bet.

The Sequoia press releases about Valeant sound like they were written by Valeant, two members of the board of trustees resigned in protest, a third was close to following them and James Stewart, writing for The New York Times, described “Sequoia’s infatuation with Valeant.” In a desperate gesture, Sequoia’s David Poppe tried to analogize Sequoia’s investment in Valeant with a long-ago bet on Berkshire Hathaway. Mr. Stewart drips acid on the argument.

Sequoia’s returns may well rebound. Their legendary reputation, built over decades of principled decision-making, will not. Our November story on Sequoia ended this way:

Sequoia’s recent shareholder letter concludes by advising Valeant to start managing with “an eye on the company’s long-term corporate reputation.” It’s advice that we’d urge upon Sequoia’s managers as well.

Farewell to Irving Kahn

Mr. Kahn died at his home in February 2015. At age 109, he was the nation’s oldest active professional investor. He began trading in the summer of 1929, made good money by shorting overvalued stock at the outset of the Crash, and continued working steadily for 85 more years. He apprenticed with Benjamin Graham and taught, at Graham’s behest, at the Columbia Business School. At 108, he still traveled to his office three days a week, weather permitted. His firm, Kahn Brothers Group, manages over a billion dollars.

Where Are the Jedi When You Need Them?

edward, ex cathedra“In present-day America it’s very difficult, when commenting on events of the day, to invent something so bizarre that it might not actually come to pass while your piece is still on the presses.”

Calvin Trillin, remarking on the problems in writing satire today.

So, the year has ended and again there is no joy in Mudville. The investors have no yachts or NetJet cards but on a trailing fee basis, fund managers still got rich. The S&P 500, which by the way has 30-35% of the earnings of its component companies coming from overseas so it is internationally diversified, trounced most active managers again. We continued to see the acceleration of the generational shift at investment management companies, not necessarily having anything to do with the older generation becoming unfit or incompetent. After all, Warren Buffett is in his 80’s, Charlie Munger is even older, and Roy Neuberger kept working, I believe, well into his 90’s. No, most such changes have to do with appearances and marketing. The buzzword of the day is “succession planning.” In the investment management business, old is generally defined as 55 (at least in Boston at the two largest fund management firms in that town). But at least it is not Hollywood.

One manager I know who cut his teeth as a media analyst allegedly tried to secure a place as a contestant on “The Bachelor” through his industry contacts. Alas, he was told that at age 40 he was too old. Probably the best advice I had in this regard was a discussion with a senior infantry commander, who explained to me that at 22, a man (or woman) was probably too old to be in the front lines in battle. They no longer believed they couldn’t be killed. The same applies to investment management, where the younger folks, especially when dealing with other people’s money, think that this time the “new, new thing” really is new and this time it really is different. That is a little bit of what we have seen in the energy and commodity sectors this year, as people kept doubling down and buying on the dips. This is not to say that I am without sin in this regard myself, but at a certain point, experience does cause one to stand back and reassess. Those looking for further insight, I would advise doing a search on the word “Passchendaele.” Continuing to double down on investments especially where the profit of the underlying business is tied to the price of a commodity has often proved to be a fool’s errand.

The period between Christmas and New Year’s Day is when I usually try to catch up on seeing movies. If you go to the first showing in the morning, you get both the discounted price and, a theater that is usually pretty empty. This year, we saw two movies. I highly recommend both of them. One of them was “The Big Short” based on the book by Michael Lewis. The other was “Spotlight” which was about The Boston Globe’s breaking of the scandal involving abusive priests in the Archdiocese of Boston.

Now, I suspect many of you will see “The Big Short” and think it is hyped-up entertainment. That of course, the real estate bubble with massive fraud taking place in the underwriting and placement of mortgages happened in 2006-2008 but ….. Yes, it happened. And a very small group of people, as you will see in the story, saw it, thought something did not make sense, asked questions, researched, and made a great deal of money going against the conventional wisdom. They did not just avoid the area (don’t invest in thrifts or banks, don’t invest in home building stocks, don’t invest in mortgage guaranty insurers) but found vehicles to invest in that would go up as the housing market bubble burst and the mortgages became worthless. I wish I could tell you I was likewise as smart to have made those contrary investments. I wasn’t. However, I did know something was wrong, based on my days at a bank and on its asset-liability committee. When mortgages stopped being retained on the books by the institutions that had made them and were packaged to be sold into the secondary market (and then securitized), it was clear that, without ongoing accountability, underwriting standards were being stretched. Why? With gain-on-sale accounting, profits and bonuses were increased and stock options went into the money. That was one of the reasons I refused to drink the thrift/bank Kool-Aid (not the only time I did not go along to get along, but we really don’t change after the age of 8). One food for thought question – are we seeing a replay event in China, tied as their boom was to residential construction and real estate?

One of the great scenes in “The Big Short” is when two individuals from New York fly down to Florida to check on the housing market and find unfinished construction, mortgages on homes being occupied by renters, people owning four or five homes trying to flip them, and totally bogus underwriting on mortgage lending. The point here is that they did the research – they went and looked. Often in fund management, a lot of people did not do that. After all, fill-in-the blank sell-side firm would not be recommending purchase of equities in home builders or mortgage lenders, without actually doing the real due diligence. Leaving aside the question of conflicts of interest, it was not that difficult to go look at the underlying properties and check valuations out against the deeds in the Recorder’s Office (there is a reason why there are tax stamps on deeds). So you might miss a few of your kid’s Little League games. But what resonates most with me is that no senior executive that I can remember from any of the big investment banks, the big thrifts, the big commercial banks was criminally charged and went to jail. Instead, what seems to have worked is what I will call the “good German defense.” And another aside, in China, there is still capital punishment and what are capital crimes is defined differently than here.

This brings me to “Spotlight” where one of the great lines is, “We all knew something was going on and we didn’t do anything about it.” And the reason it resonates with me is that you see a similar conspiracy of silence in the financial services industry. Does the investor come first or the consultant? Is it most important that the assets grow so the parent company gets a bigger return on its investment, or is investment performance most important? John Bogle, when he has spoken about conflicts of interest, is right when he talks about the many conflicts that came about when investment firms were allowed to sell themselves and basically eliminate personal responsibility.

This year, we have seen the poster child for what is wrong with this business with the ongoing mess at The Third Avenue Funds. There is a lot that has been written so far. I expect more will be written (and maybe even some litigation to boot). I commend all of you to the extensive pieces that have appeared in the Wall Street Journal. But what they highlight that I don’t think has been paid enough attention to is the problem of a roll-up investment (one company buying up and owning multiple investment management firms) with absentee masters. In the case of Third Avenue, we have Affiliated Managers Group owning, as reported by the WSJ, 60% of Third Avenue, and those at Third Avenue keeping a 40% stake (to incentivize them). With other companies from Europe, such as Allianz, the percentages may change but the ownership is always majority. So, 60% of the revenues come off the top, and the locals are left to grow the business, reinvest in it by hiring and retaining talent, focus on investment performance, etc., with their percentage. Unfortunately, when the Emperor is several states, or an ocean away, one often does not know what is really going on. You get to see numbers, you get told what you want to hear (ISIS has been contained, Bill Gross is a distraction to the other people), and you accept it until something stops working.

So I leave you with my question for you all to ponder for 2016. Is the 1940 Act mutual fund industry, the next big short? Investors, compliments of Third Avenue, have now been reminded that daily liquidity and redemption is that until it is not. As I have mentioned before, this is an investment class with an unlimited duration and a mismatch of assets and liabilities. This is perhaps an unusual concern for a publication named “Mutual Fund Observer.” But I figure if nothing else, we can always start a separate publication called “Mutual Fund Managers Address Book” so you can go look at the mansions and townhouses in person.

– by Edward A. Studzinski

Quietly successful: PYGSX, RSAFX, SCLDX, ZEOIX

Amidst the turmoil, a handful of the funds we’re profiled did in 2015 exactly what they promised. They made a bit of money with little drama and, sadly, little attention. You might want to glance in their direction if you’ve found that your managers were getting a little too creative and stretching a little too far in their pursuit of “safe” income.

Payden Global Low Duration (PYGSX): the short-term global bond fund made a modest 0.29% in 2015 while its peers lost about 4.6%. In our 2013 profile we suggested that “flexibility and opportunism coupled with experienced, disciplined management teams will be invaluable” and that Payden offered that combo.

Riverpark Structural Alpha (RSAFX): this tiny fund used a mix of options which earned their investors 1.3% while its “market neutral” peers lost money. The fund, we suggested, was designed to answer the question, “where should investors who are horrified by the prospects of the bond market but are already sufficiently exposed to the stock market turn for stable, credible returns?” It’s structurally exposed to short-term losses but also structurally designed to rebound, automatically and quickly, from them. In the last five years, for example, it’s had four losing quarters but has never had back-to-back losing quarters.

Scout Low Duration Bond Fund (SCLDX): this flexible, tiny short-term bond tiny fund made a bit of money in 2015 (0.6%), but it’s more impressive that the underlying strategy also made money (1.4%) during the 2008 meltdown. Mr. Eagan, the lead manager, explained it this way: “Many short-term bond funds experienced negative returns in 2008 because they were willing to take on what we view as unacceptable risks in the quest for incremental yield or income …When the credit crisis occurred, the higher risks they were willing to accept produced significant losses, including permanent impairment. We believe that true risk in fixed income should be defined as a permanent loss of principle. Focusing on securities that are designed to avoid this type of risk has served us well through the years.”

Zeo Strategic Income (ZEOIX): this short-term, mostly high-yield fund made 2.0% in 2015 while its peers dropped 4.1%. It did a particularly nice job in the third quarter, making a marginal gain as the high-yield market tanked. Positioned as a home for your “strategic cash holdings,” we suggested that “Modestly affluent folks who are looking to both finish ahead of inflation and sleep at night should likely make the effort to reach out and learn more.”

RiverPark Short-Term High Yield (RPHYX) likewise posted a gain – 0.86% – for the year but remains closed to new investors. PIMCO Short Asset Investment (PAIUX) which provides the “cash” strategy for all the PIMCO funds, eked out a 0.25% gain, modestly ahead of its ultra-short peers. 

These are very different strategies, but are unified by the presence of thoughtful, experienced managers who are exceedingly conscious of market risk.

Candidates for Rookie of the Year

We’ve often asked, by journalists and others, which are the young funds to keep an eye on. We decided to search our database for young funds that have been exceptionally risk-sensitive and have, at the same time, posted strong returns over their short lives. We used our premium screener to identify funds that had several characteristics:

They were between 12 and 24 months old; that is, they’d completed at least one full year of existence but were no more than two. I suspect a few funds in the 2-3 year range slipped through, but it should be pretty few.

They had a Martin Ratio greater than one; the Martin Ratio is a variation of the Sharpe ratio which is more sensitive to downward movements

They had a positive Sharpe ratio and had one of the five highest Sharpe ratios in their peer group.

Hence: young, exceptional downside sensitivity so far and solid upside. We limited our search to a dozen core equity categories, such as Moderate Balanced and Large Growth.

In all of these tables, “APR vs Peer” measures the difference in Annual Percentage Return between a fund’s lifetime performance and its average peers. A fund might have a 14 month record which the screener annualizes; that is, it says “at this rate, you’d expect to earn X in a year.” That’s important because a fund with a scant 12 month record is going to look a lot worse than one at 20 or 24 months since 2015, well, sucked.

Herewith, the 2016 Rookie of the Year nominees:

Small cap rookies Sharpe Ratio Martin Ratio APR vs Peer  
Acuitas US Microcap (AFMCX) 0.83 3.10 9.6 Three sets of decent sub-advisors, tiny market cap but the fund is institutional only.
Hodges Small Intrinsic Value (HDSVX) 0.79 2.37 9.3 Same team that manages the five-star Hodges Small Cap fund.
Perritt Low Priced Stock (PLOWX) 0.74 2.05 8.8 The same manager runs Perritt UltraMicro and Microcap Opportunities, neither of which currently look swift when benchmarked against funds that invest in vastly larger stocks.
Hancock Horizon US Small Cap (HSCIX) 0.70 2.61 8.6 Hmmm… the managers also run, with limited distinction, Hancock Horizon Growth, a large cap fund.
SunAmerica Small-Cap (SASAX) 0.70 2.51 8.1 Some overlap with the management team for AMG Managers Cadence Emerging Companies, a really solid little institutional fund.


Mid cap rookies Sharpe Ratio Martin Ratio APR vs Peer  
PowerShares S&P MidCap Low Volatility Portfolio (XMLV) 0.99 4.11 10.4 Low vol. Good thought.
Diamond Hill Mid Cap (DHPAX) 0.75 3.22 7.9 In various configurations, members of the team are responsible for six other Diamond Hill funds, some very fine.
Nuance Mid Cap Value (NMAVX) 0.45 2.03 6.7 Two years old; kinda clubbed its competition in 2015. The lead manager handled $10 billion as an American Century manager.
Hodges Small-to-Midcap (HDSMX) 0.43 1.32 5.5 Same team that manages the five-star Hodges Small Cap fund.
Barrow Value Opportunity (BALAX) 0.41 1.58 5.3 David Bechtel talked through the fund’s strategy in a 2014 Elevator Talk.


Large cap rookies Sharpe Ratio Martin Ratio APR vs Peer  
iShares MSCI USA Momentum Factor ETF (MTUM) 0.64 2.68 3.6 Momentum tends to dominate at the ends of bull markets, so this isn’t particularly surprising.
iShares MSCI USA Quality Factor ETF (QUAL) 0.53 2.61 2.5  
Arin Large Cap Theta (AVOLX) 0.52 2.73 4.5 A covered call fund that both M* and Lipper track as if it were simple large cap equity.
SPDR MFS Systematic Core Equity ETF (SYE) 0.48 1.99 6 An active ETF managed by MFS
SPDR MFS Systematic Value Equity ETF (SYV) 0.46 1.8 8.0 And another.

Hmmm … you might notice that the large cap list is dominated by ETFs, two active and two passive. There were a larger number of active funds on the original list but I deleted Fidelity funds (three of them) that were only available for use by other Fidelity managers.

Multi-cap rookies Sharpe Ratio Martin Ratio APR vs Peer  
SPDR MFS Systematic Growth Equity ETF (SYG) 0.74 3.3 10.4 Another active ETF managed by MFS
Segall Bryant & Hamill All Cap (SBHAX) 0.69 2.73 5.4 The lead manager used to run a Munder health care fund. M* treats this as a large growth fund, a category in which it does not excel.
Riverbridge Growth (RIVRX) 0.66 2.43 4.6 The team has been subadvising a Dreyfus Select Managers small cap fund for about five years.
AT Mid Cap Equity (AWMIX) 0.52 1.74 3.5 AT is Atlantic Trust, once known for the Atlantic Whitehall funds. It’s currently limiting itself to rich folks. Pity.
BRC Large Cap Focus Equity (BRCIX) 0.37 1.31 5.3 Institutional only. Pity.

This is another category where we had to dump a bunch of internal-only Fidelity funds. It’s interesting that no passive fund was even near the top of the list, perhaps because the ability to move between size ranges is active and useful?

Global rookies Sharpe Ratio Martin Ratio APR vs Peer  
William Blair Global Small Cap Growth (WGLIX) 0.99 3.99 11.9 Sibling to an excellent but closed international small growth fund. They’re liquidating it anyway (Thanks for the reminder, JoJo).
Vanguard Global Minimum Volatility (VMVFX) 0.96 3.96 9.4 A fund we profiled.
WCM Focused Global Growth (WFGGX) 0.81 3.48 11.2 The team runs eight funds, mostly as sub-advisors, including the five star Focused International Growth fund.
QS Batterymarch Global Dividend (LGDAX) 0.3 1.16 8.1  
Scharf Global Opportunity (WRLDX) 0.3 1.14 4.1 0.50% e.r. The same manager runs four or five Scharf funds, several with exceptional track records.

At the other end of the spectrum, it was durn tough to find strong performance among “rookie” international funds. In the emerging markets arena, for example, just one fund had a positive Martin Ratio: Brown Advisory Emerging Markets Small-Cap (BIANX). Everyone else was down a deep, deep hole.

While we’re not endorsing any of these funds just yet, they’ve distinguished themselves with creditable starts in tough markets. In the months ahead, we’ll be trying to learn more about them on your behalf.

For the convenience of MFO Premium members who are interesting in digging into rookie funds more deeply, Charles created a preset screen for high-achieving younger funds. He offers dozens of data points on each of those funds where we only have room, or need, for a handful here.

Premium Site Update

charles balconyNew to MFO Premium this month are several additions to the MultiSearch Tool, which now can screen our monthly fund database with some 44 performance metrics and other parameters. (Here are links to current Input and Output MultiSearch Parameter Lists.) The new additions include SubType (a kind of super category), exchange-traded fund (ETF) flag, Profiled Funds flag, and some initial Pre-Set Screens.

SubType is a broad grouping of categories. Lipper currently defines 144 categories, excluding money market funds. MFO organizes them into 9 subtypes: U.S. Equity, Mixed Asset, Global Equity, International Equity, Sector Equity, Commodity, Alternative & Other, Bond, and Municipal Bond funds. The categories are organized further into broader types: Fixed Income, Asset Allocation, and Equity funds. The MultiSearch Tool enables screening of up to 9 categories, 3 subtypes, or 2 types along with other criteria.

The Profiled Funds flag enables screening of funds summarized monthly on our Dashboard (screenshot here). Each month, David (and occasionally another member of MFO’s staff), typically provides in-depth analysis of two to four funds, continuing a FundAlarm tradition. Through November 2015, 117 profiles are available on MFO legacy site Funds page. “David’s Take” precariously attempts to distill the profile into one word: Positive, Negative, or Mixed.

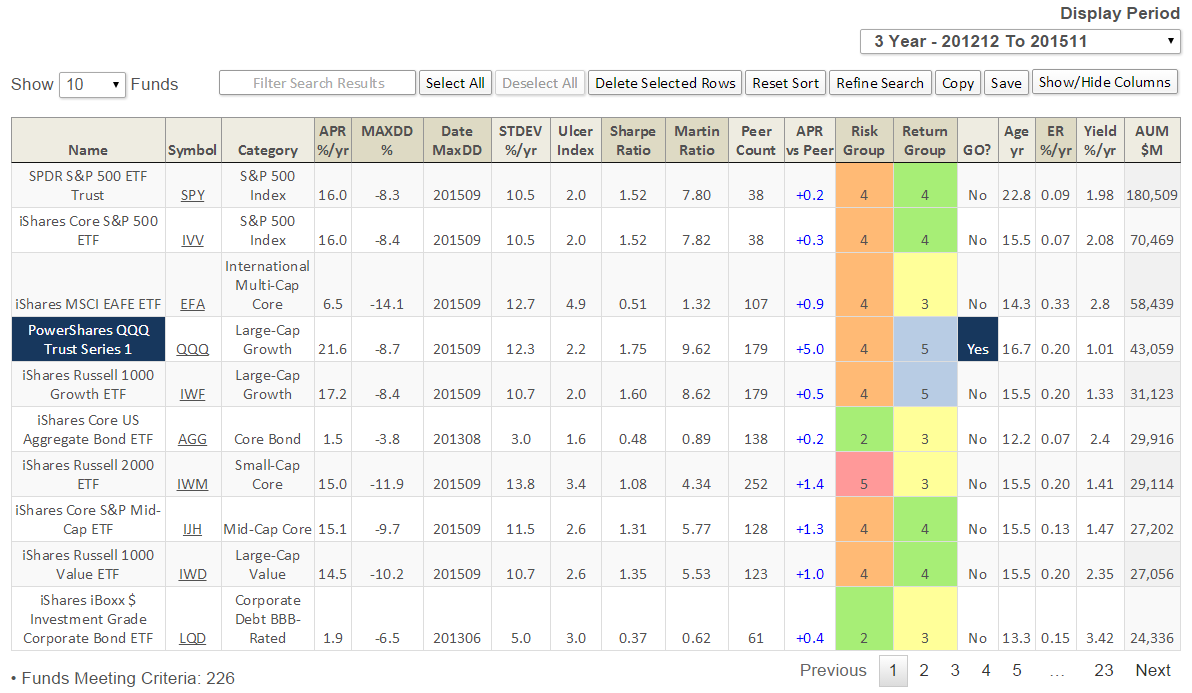
The ETF flag is self-explanatory, of course. How many ETFs are in our November database? A lot! 1,716 of the 9,034 unique (aka oldest share class) funds we cover are ETFs, or nearly 19%. The most populated ETF subtype is Sector Equity with 364, followed by International Equity with 343, US Equity with 279, and Bonds with 264. At nearly $2T in assets under management (AUM), ETFs represent 12% of the market. Our screener shows 226 ETFs with more than $1B in AUM. Here is a summary of 3-year performance for top ten ETFs by AUM (click on image to enlarge):

update_1
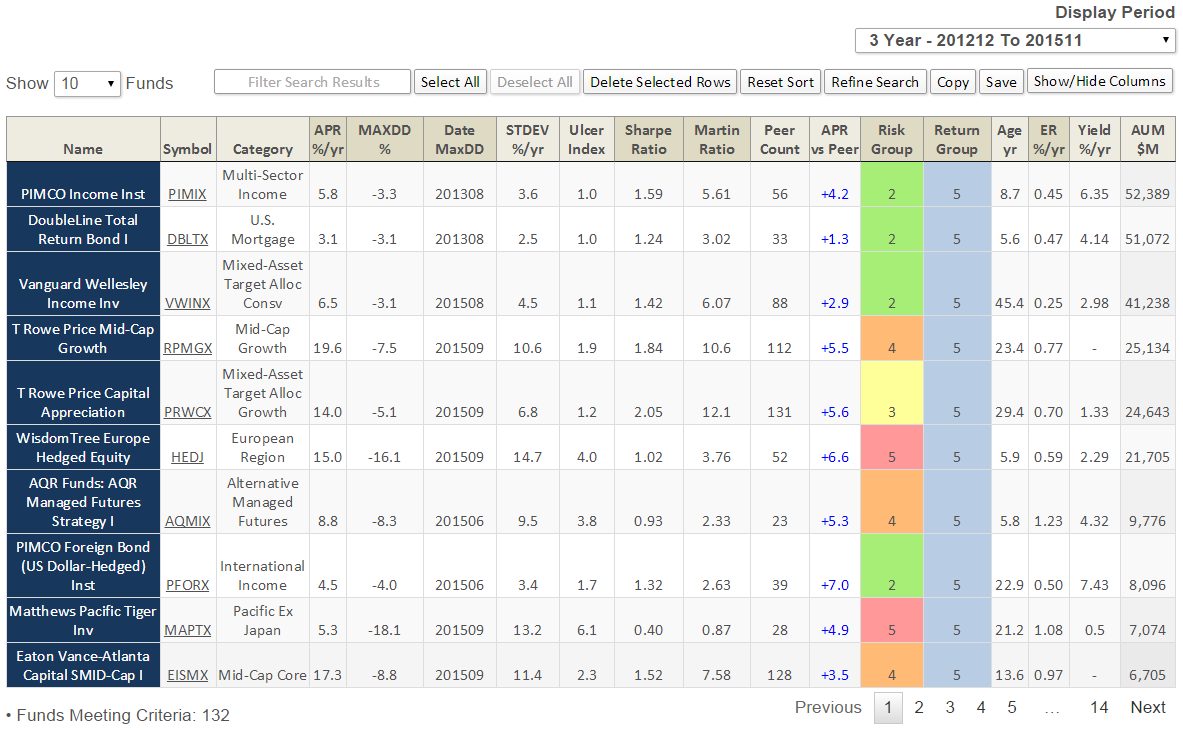
The Pre-Set Screen option is simply a collection of screening criteria. The two initial screens are “Best Performing Rookie Funds” and “Both Great Owl and Honor Roll Funds.” The former generates a list of 160 funds that are between the age of 1 and 2 years old and have delivered top quintile risk adjusted return (based on Martin Ratio) since their inception. The latter generates a list of 132 funds that have received both our Great Owl distinction as well as Honor Roll designation. Here is a summary of 3-year performance for top ten such funds, again by AUM (click on image to enlarge) … it’s an impressive list:

update_2Other Pre-Screens David has recommended include “moderate allocation funds with the best Ulcer Index, small caps with the shortest recovery times, fixed-income funds with the smallest MAXDD …” Stay tuned.

Along with the parameters above, new options were added to existing criteria in the MultiSearch Tool. These include 30, 40, and 50 year Age groups; a “Not Three Alarm” rating; and, a “0% Annual or More” Absolute Return setting.

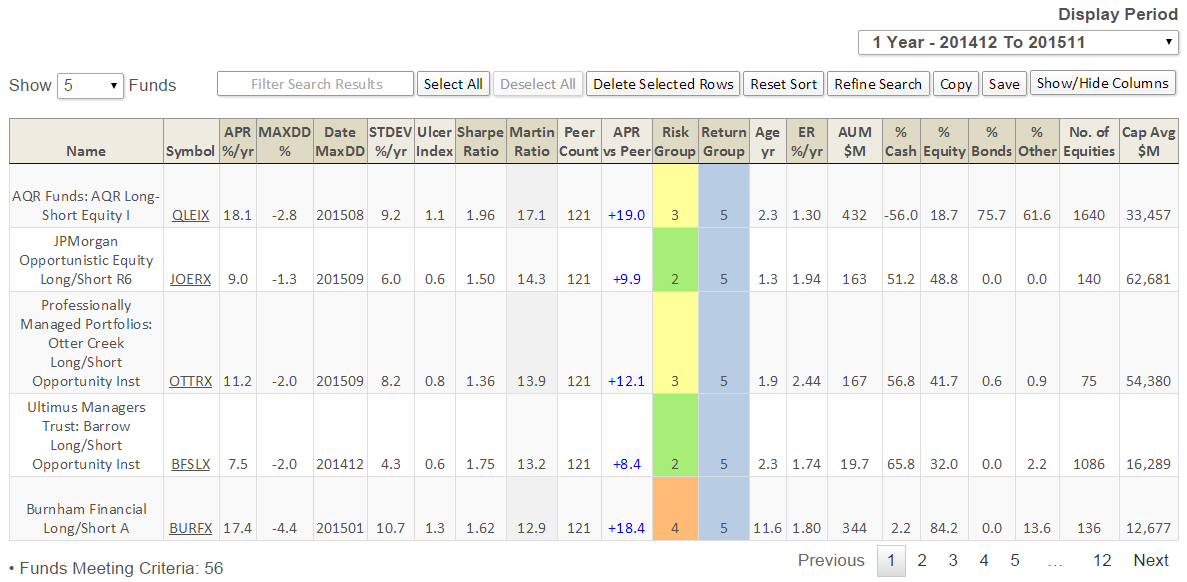
Using the new “0% Annual or More” criterion, we can get a sense of how tough the past 12 months have been for mutual funds. Of the 8,450 funds across all categories at least 12 months old through November 2015, nearly 60% (4,835) returned less than 0% for the year. Only 36 of 147 moderate allocation funds delivered a positive return, which means nearly 75% lost money … believe it or not, this performance was worse than the long/short category.

A closer look at the long/short category shows 56 of 121 funds delivered positive absolute return. Of those, here are the top five based on risk adjusted return (Martin Ratio) … click on image to enlarge:

update_3

AQR Long/Short

AQR’s rookie Long/Short Equity I (QLEIX) has been eye-watering since inception, as can be seen in its Risk Profile (click on images to enlarge):

update_4

update_5

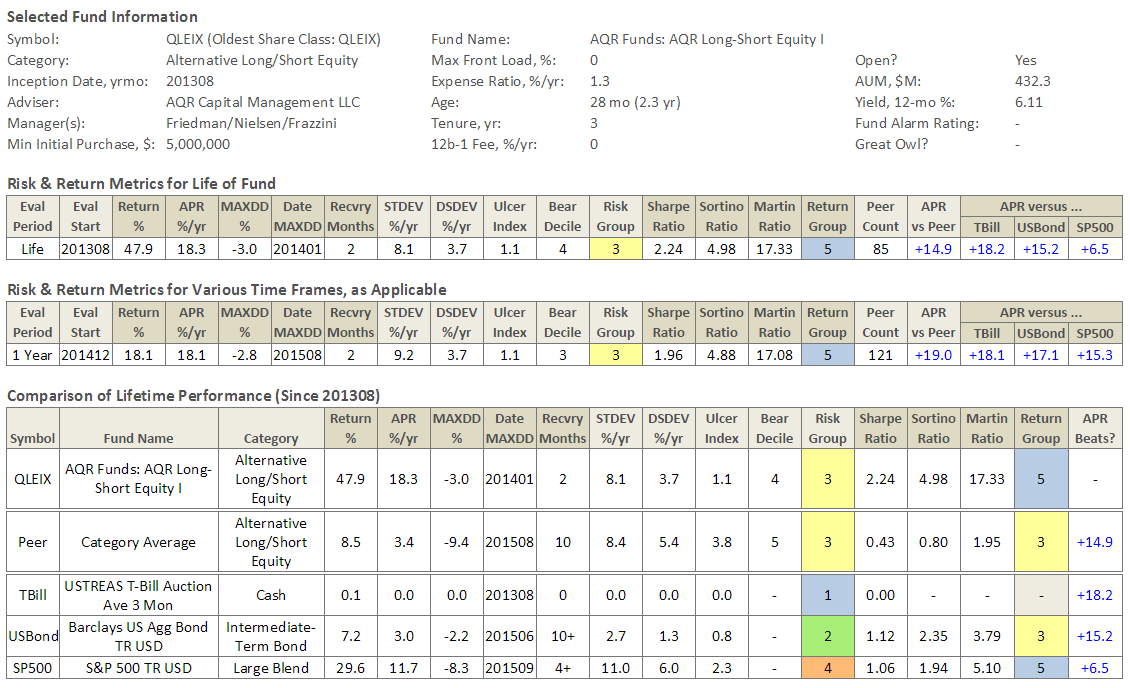
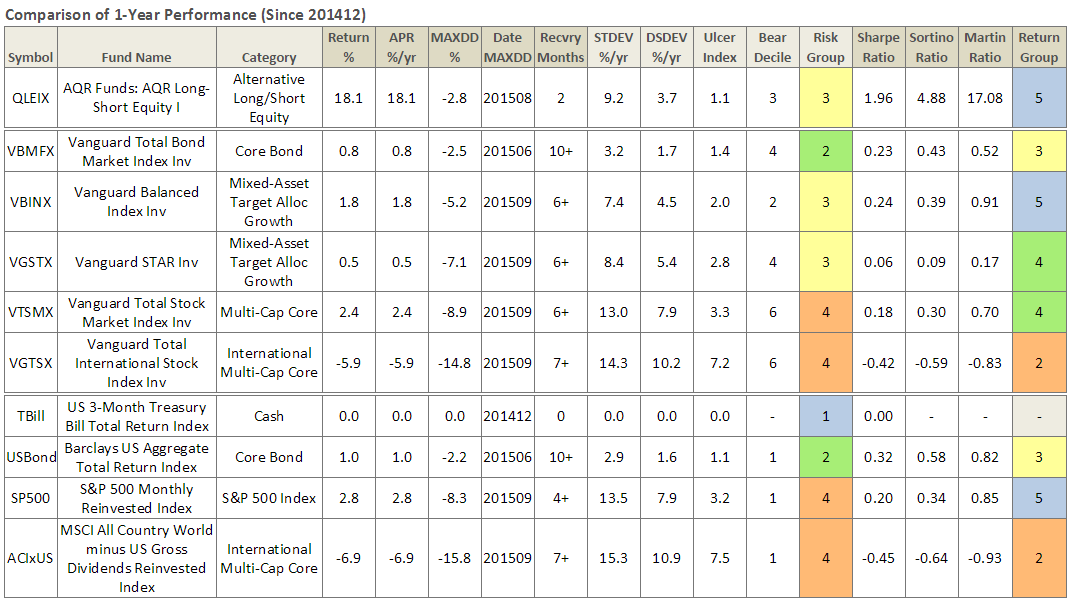
While I’ve always been a fan of Cliff Asness and the strategies at AQR, I’m not a fan of AQR Funds, since experiencing unfriendly shareholder practices, namely lack of disclosure when its funds underperform … but nothing speaks like performance.

Whitebox Funds

I have also always been a fan of Andrew Redleaf and Whitebox Funds, which we featured in the March 2015 Whitebox Tactical Opportunities 4Q14 Conference Call and October 2013 Whitebox Tactical Opportunities Conference Call. David has remained a bit more guarded, giving them a “Mixed” profile in April 2013 Whitebox Market Neutral Equity Fund, Investor Class (WBLSX), April 2013.

This past month the Minneapolis-based shop decided to close its three open-end funds, which were based on its hedge-fund strategies, less than four years after launch. A person familiar with the adviser offered: “They were one large redemption away from exposing remaining investors to too great a concentration risk … so, the board voted to close the funds.” AUM in WBMIX had grown to nearly $1B, before heading south. According to the same person, Whitebox hedge funds actually attracted $2B additional AUM the past two years and that was where they wanted to concentrate their efforts.

The fund enjoyed 28 months (about as long as QLEIX is old) of strong performance initially, before exiting the Mr. Market bus. Through November 2015, it’s incurred 19 consecutive months of drawdown and a decline from its peak of 24.2%. Depicting its rise and fall, here is a Morningstar growth performance plot of WBMIX versus Vanguard’s Balanced Fund Index (VBINX), as well as the MFO Risk Profile (click on images to enlarge):

update_6

update_7

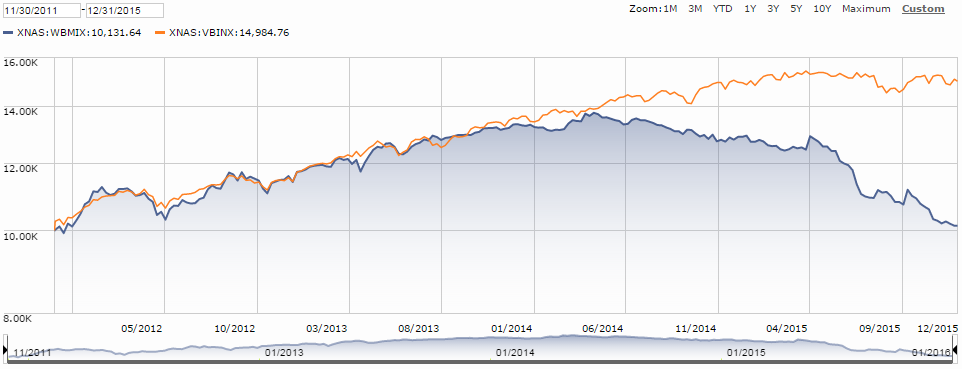
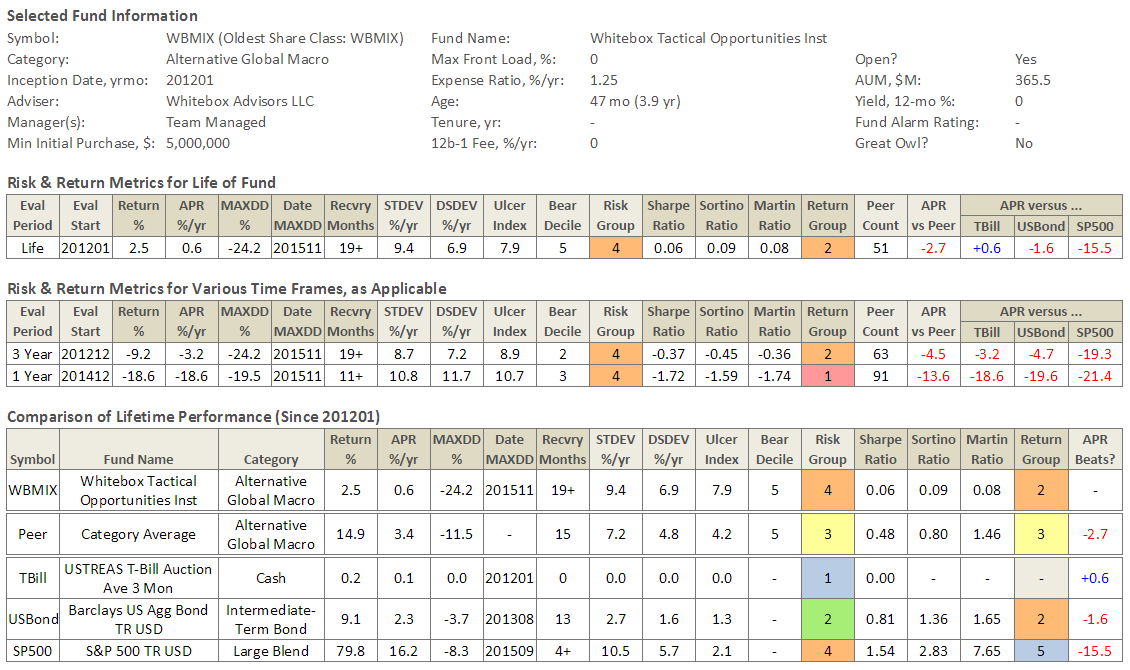
Ultimately, Mr. Redleaf and company failed to deliver returns across the rather short life span of WBMIX consistent with their goal of “the best endowments.” Ultimately, they also failed to deliver performance consistent with the risk tolerance and investment timeframe of its investors. Ultimately and unfortunately, there was no “path to victory” in the current market environment for the fund’s “intelligent value” strategy, as compelling as it sounded and well-intended as it may have been.

As always, a good discussion can be found on the MFO Board Whitebox Mutual Funds Liquidating Three Funds, along with news of the liquidations.

Year-end MFO ratings will be available on or about 4th business day, which would be January 7th on both our premium and legacy sites.

Snow Tires and All-Weather portfolios

Leigh Walzer, founder and principal of Trapezoid, LLC. Leigh’s had a distinguished career working in investment management, in part in the tricky field of distressed securities analysis. He plied that trade for seven years with Michael Price and the Mutual Series folks. He followed that with a long stint as a director at Angelo, Gordon & Co., a well-respected alternatives manager and a couple private partnerships. Through it all, Leigh has been insatiably curious about not just “what works?” but, more importantly, “why does it work?” That’s the work now of Trapezoid LLC.

Leigh Walzer, founder and principal of Trapezoid, LLC. Leigh’s had a distinguished career working in investment management, in part in the tricky field of distressed securities analysis. He plied that trade for seven years with Michael Price and the Mutual Series folks. He followed that with a long stint as a director at Angelo, Gordon & Co., a well-respected alternatives manager and a couple private partnerships. Through it all, Leigh has been insatiably curious about not just “what works?” but, more importantly, “why does it work?” That’s the work now of Trapezoid LLC.

By Leigh Walzer

Readers of a certain age will remember when winter meant putting on the snow tires. All-season tires were introduced in 1978 and today account for 96% of the US market. Not everyone is sure this is a good idea; Edmunds.com concludes “snow and summer tires provide clear benefits to those who can use them.”

As we begin 2016, most of the country is getting its first taste of winter weather. “Putting on the snow tires” is a useful metaphor for investors who are considering sacrificing performance for safety. Growth stocks have had a great run while the rest of the market sits stagnant. Fed-tightening, jittery credit markets, tight-fisted consumer, commodity recession, and sluggishness outside the US are good reasons for investor caution.

Some clients have been asking if now is a good time to dial back allocations to growth. In other words, should they put the snow tires on their portfolio.

The dichotomy between growth and value and the debate over which is better sometimes approaches theological overtones. Some asset allocators are convinced one or the other will outperform over the long haul. Others believe each has a time and season. There is money to be made switching between growth and value, if only we had 20/20 hindsight about when the business cycle turns.

When has growth worked better than value?

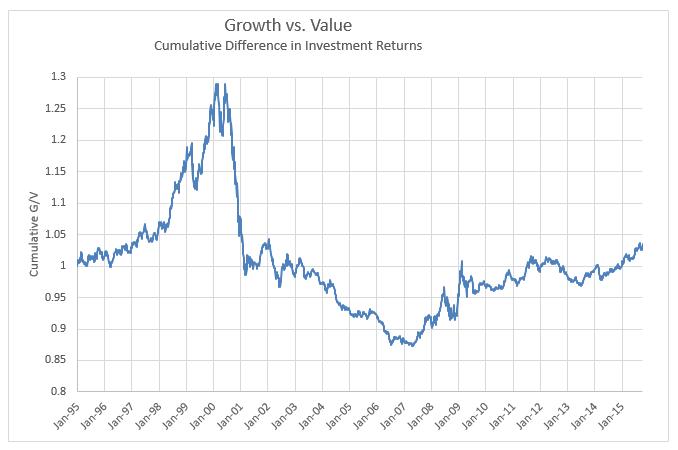
Historically, the race between growth and value has been nearly a dead heat. Exhibit 1 shows the difference in the Cumulative return of Growth and Value strategies over the past twenty years. G/V is a measure of the difference in return between growth and value in a given period Generally speaking, growth performed better in the 90s, a period of loose money up to the internet bust. Value did better from 2000-2007. Since 2007, growth has had the edge despite a number of inflections. Studies going back 50 years suggest value holds a slight advantage, particularly during the stagflation of the 1970s.

Exhibit I

exhibit1

Growth tends to perform better in up-markets. This relationship is statistically valid but the magnitude is almost negligible. Over the past twenty years Trapezoid’s US Growth Index had a beta of 1.015 compared with 0.983 for Value.

Exhibit II

exhibit2

The conventional wisdom is that growth stocks should perform better early to mid-cycle while value stocks perform best late in the business cycle and during recession. That might loosely describe the 90s and early 2000s. However, in the run up the great recession, value took a bigger beating as financials melted down. And when the market rebounded in April 2009, value led the recovery for the first six months.

Value investors expect to sacrifice some upside capture in order to preserve capital during declining markets. Exhibit III, which uses data from Morningstar.com about their Large Growth (“LG”) and Large Value (“LV”) fund categories, shows the reality is less clear. In 2000-2005 LV lived up to its promise: it captured 96% of LG’s upside but only 63% of its downside. But since 2005 LV has actually participated more in the downside than LG.

Exhibit III

2001-2005 2006-2010 2011- 2015
       
LG Upside Capture 105% 104% 98%
LG Downside Capture 130% 101% 106%
       
LV Upside Capture 101% 99% 94%
LV Downside Capture 82% 101% 111%
       
LV UC / LG Up Capt 96% 95% 97%
LV DC / LG Dn Capt 63% 100% 104%

Recent trend

In 2015 (with the year almost over as of this writing), value underperformed growth by about 5%. Value funds are overweight energy and underweight consumer discretionary which contributed to the shortfall.

Can growth/value switches be predicted accurately?

In the long haul, the two strategies perform nearly equally. If the weatherman can’t predict the snow, maybe it makes sense to leave the all-season tires on all year.

We can look through the historical Trapezoid database to see which managers had successfully navigated between growth and value. Recall that Trapezoid uses the Orthogonal Attribution Engine to attribute the performance of active equity managers over time to a variety of skills. Trapezoid calculates the contribution to portfolio return from overweighting growth or value in a given period. We call this sV.

Demonstrable skill shifting between growth and value is surprisingly scarce.

Bear in mind that Trapezoid LLC does not call market turns or rate sectors for timeliness. And Trapezoid doesn’t try to forecast whether growth or value will work better in a given period. But we do try to help investors make the most of the market. And we look at the historic and projected ability of money managers to outperform the market and their peer group based on a number of skills.

The Trapezoid data does identify managers who scored high in sV during particular periods. Unfortunately, high sV doesn’t seem to carry over from period to period. As Professor Snowball would say, sV lacks predictive validity; the weatherman who excelled last year missed the big storm this year. However, the data doesn’t rule out the possibility that some managers may have skill. As we have seen, growth or value can dominate for many years, and few managers have sufficient tenure to draw a strong conclusion.

We also checked whether market fundamentals might help investors allocate between growth and value. We are aware of one macroeconomic model (Duke/Fuqua 2002) which claims to successfully anticipate 2/3 of growth and value switches over the preceding 25 years.

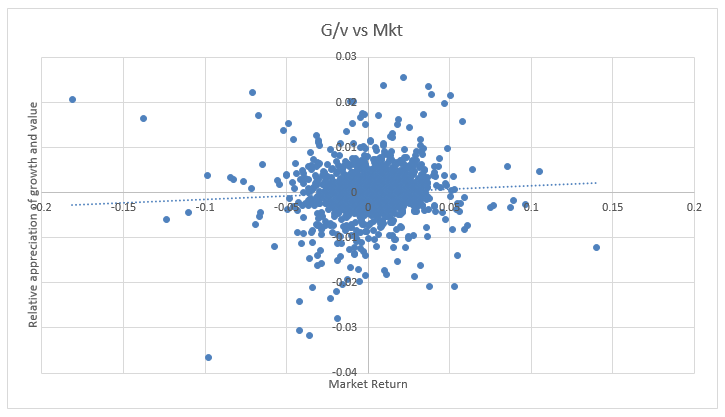
One hypothesis is that value excels when valuations are stretched while growth excels when the market is not giving enough credit to earnings growth. In principle this sounds almost tautologically correct. However, implementing an investment strategy is not easy. We devised an index to see how much earnings growth the market is pricing in a given time (S&P500 E/P less 7-year AAA bond yield adjusted for one year of earning growth). When the index is high, it means either the equity market is attractive relative bonds or that the market isn’t pricing in much earnings growth. Conversely, when the index is low it means valuations of growth stocks are stretched and therefore investors should load up on value. We looked at data from 1995-2015 and compared the relative performance of growth and value strategies over the following 12 months. We expected that when the index is high growth would do better.

Exhibit IV

exhibit4

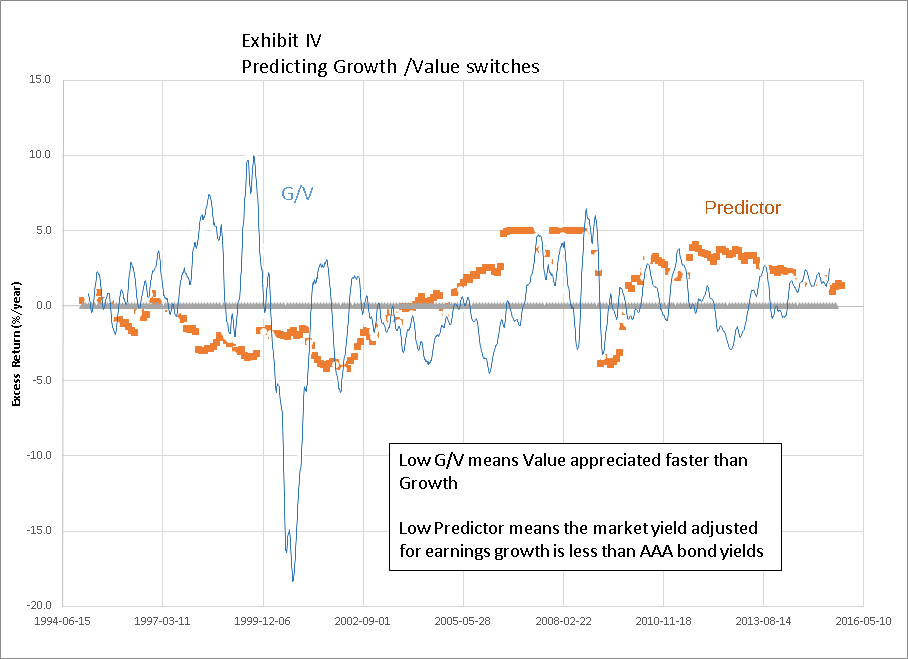
There are clearly times when investors who heeded this strategy would have correctly anticipated investing cycles. We found the index was directionally correct but not statistically significant. Exhibit IV shows the Predictor has been trending lower in 2015 which would suggest that the growth cycle is nearly over.

All-Weather Managers

Since it is hard to tell when value will start working, investors could opt for all-weather managers, i.e. managers with a proven ability to thrive during value and growth periods.

We combed our database for active equity managers who had an sV contribution of at least 1%/year in both the growth era since 1q07 and the value market which preceded it. Our filter excludes a large swath of managers who haven’t been around 9 years. Only six funds passed this screen – an indication that skill at navigating between growth and value is rare. We knocked out four other funds because, using Trapezoid’s standard methodology, projected skill is low or expenses are high. This left just two funds.

Century Shares Trust (CENSX), launched in 1928, is one of the oldest mutual funds in the US. The fund tracks itself against the Russell 1000 Growth Index but does not target a particular sector mix and apply criteria like EV/EBITDA more associated with value. Expenses run 109bps. CENSX’s performance has been strong over the past three years. Their long-term record selecting stocks and sectors is not sufficient for inclusion in the Trapezoid Honor Roll.

exhibit5
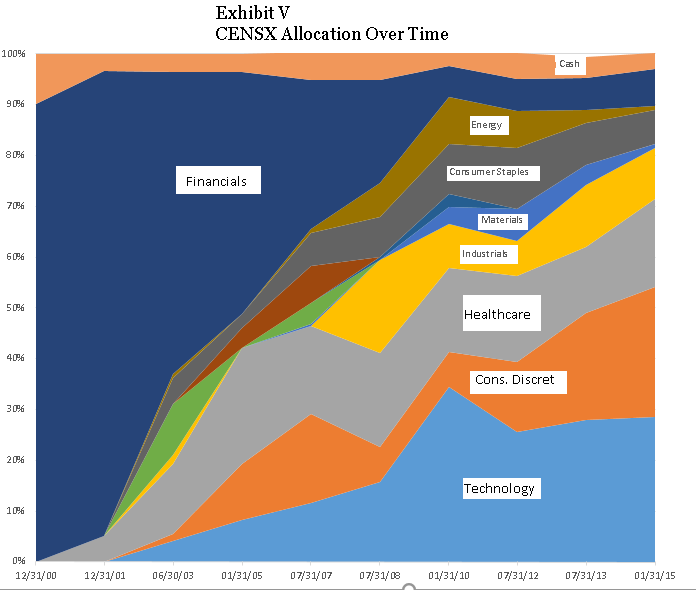
Does CENSX merit extra consideration because of the outstanding contribution from rotating between growth and value? Serendipity certainly plays a part. As Exhibit V illustrates, the current managers inherited in 1999 a fund which was restricted by its charter to financials, especially insurance. That weighting was very well-suited to the internet bust and recession which followed. They gradually repositioned the portfolio towards large growth. And he has made a number of astute switches. Notably, he emphasized consumer discretionary and exited energy which has worked extremely well over the past year. We spoke to portfolio manager Kevin Callahan. The fund is managed on a bottom-up fundamentals basis and does not have explicit sector targets. But he currently screens for stocks from the Russell 1000 Growth Index and seem reluctant to stray too far from its sector weightings, so we expect growth/value switching will be much more muted in the future.

exhibit6

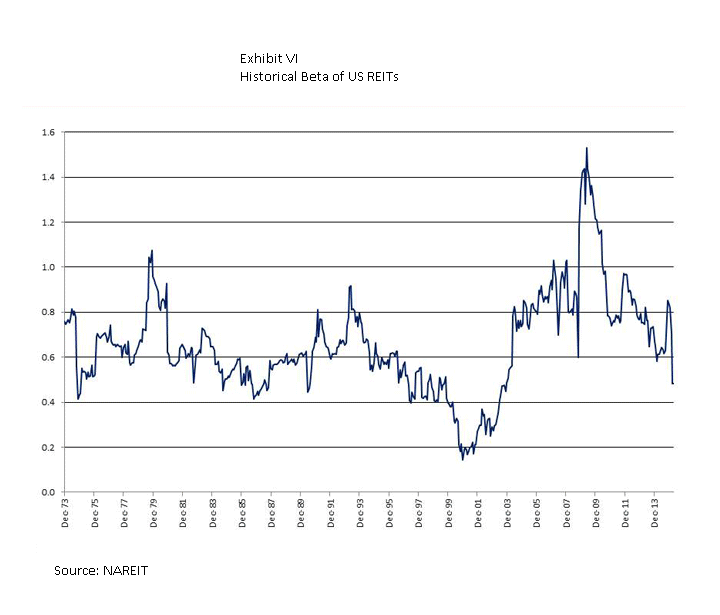
The other fund which showed up is Cohen & Steers Global Realty Fund (CSSPX). The entire real estate category had positive sV over the past 15-20 years; real estate (both domestic and global) clobbered the market during the value years, gave some back in the run-up to the financial crisis, and has been a market performer since then.

We are not sure how meaningful it is that CSSPX made this list over some other real estate funds with similar focus and longevity. Investors may be tempted to embrace real estate as an all-weather sector. But over the longer haul real estate has had a more consistent market correlation with beta averaging 0.6 which means it participated equally in up and down markets.

More complete information can be found at www.fundattribution.com. MFO readers can sign up for a free demo. Please click the link from the Model Dashboard (login required) to the All-Weather Portfolio.

The All-Season Portfolio

Since we are not sure that good historic sV predicts future success and managers with a good track record in this area are scarce, investors might take a portfolio approach to all-season investing.

  1. Find best of breed managers. Use Trapezoid’s OAE to find managers with high projected skill relative to cost. While the Trapezoid demo rates only Large Blend managers (link to the October issue of MFO), the OAE also identifies outstanding managers with a growth or value orientation.
  2. Strike the right balance. Many thoughtful investors believe “value is all you need” and some counsel 100% allocation to growth. Others apply age-based parameters. Based on the portfolio-optimization model I consulted and my dataset, the recommended weighting of growth and value is nearly 50/50. In other words: snow tires on the front, summer tires on the back. (Note this recommendation is for your portfolio, for auto advice please ask a mechanic.) I used 20 years of data; using a longer time frame, value might look better.

Bottom line:

It is hard to predict whether growth or value will outperform in a given year. Demonstrable skill shifting between growth and value is surprisingly scarce. Investors who are content to be passive can just stick to funds which index the entire market. A better strategy is to identify skillful growth and value managers and weight them evenly.

Slogo 2What’s the Trapezoid story? Leigh Walzer has over 25 years of experience in the investment management industry as a portfolio manager and investment analyst. He’s worked with and for some frighteningly good folks. He holds an A.B. in Statistics from Princeton University and an M.B.A. from Harvard University. Leigh is the CEO and founder of Trapezoid, LLC, as well as the creator of the Orthogonal Attribution Engine. The Orthogonal Attribution Engine isolates the skill delivered by fund managers in excess of what is available through investable passive alternatives and other indices. The system aspires to, and already shows encouraging signs of, a fair degree of predictive validity.

The stuff Leigh shares here reflects the richness of the analytics available on his site and through Trapezoid’s services. If you’re an independent RIA or an individual investor who need serious data to make serious decisions, Leigh offers something no one else comes close to. More complete information can be found at www.fundattribution.com. MFO readers can sign up for a free demo.

The Alt Perspective: Commentary and news from DailyAlts.

dailyaltsAs they say out here in Los Angeles, that’s a wrap. 2015 has come to a close and we begin anew. But before we get too far into 2016, let’s do a quick recap of some of the activity in the liquid alternatives market that occurred over the past year, starting with a performance review.

Performance Review

Let’s start with traditional asset classes for the full year of 2015, where the average mutual fund for all of the major asset classes (per Morningstar) delivered negative performance on the year:

  • Large Blend U.S. Equity: -1.06%
  • Foreign Equity Large Blend: -1.56%
  • Diversified Emerging Markets: -13.83%
  • Intermediate Term Bond: -0.35%
  • World Bond: -4.09%
  • Moderate Allocation: -1.96%

Now a look at the liquid alternative categories, per Morningstar’s classification. As with the traditional asset classes, none of the alternative categories escaped a negative return on the year:

  • Long/Short Equity: -2.08%
  • Non-Traditional Bonds: -1.84%
  • Managed Futures: -1.06%
  • Market Neutral: -0.39%
  • Multi-Alternative: -2.48%
  • Bear Market: -3.16%

And a few non-traditional asset classes, where real estate generated a positive return:

  • Commodities: -24.16%
  • Multi-Currency: -0.62%
  • Real Estate: 2.39%
  • Master Limited Partnerships: -35.12%

Overall, a less than impressive year across the board with energy leading the way to the bottom.

Asset Flows

Flows into alternative mutual funds and ETFs remained fairly constant over the year in terms of where the flows were directed, with a total of $20 billion of new assets being allocated to funds in Morningstar’s alternative categories. However, non-traditional bond funds, which are not included in Morningstar’s alternatives categories, saw nearly $10 billion of outflows through November.

While the flows appeared strong, only three categories had net positive flows over the past twelve months: Multi-alternative funds, managed futures funds and volatility based funds. The full picture is below (data source: Morningstar):

asset flows

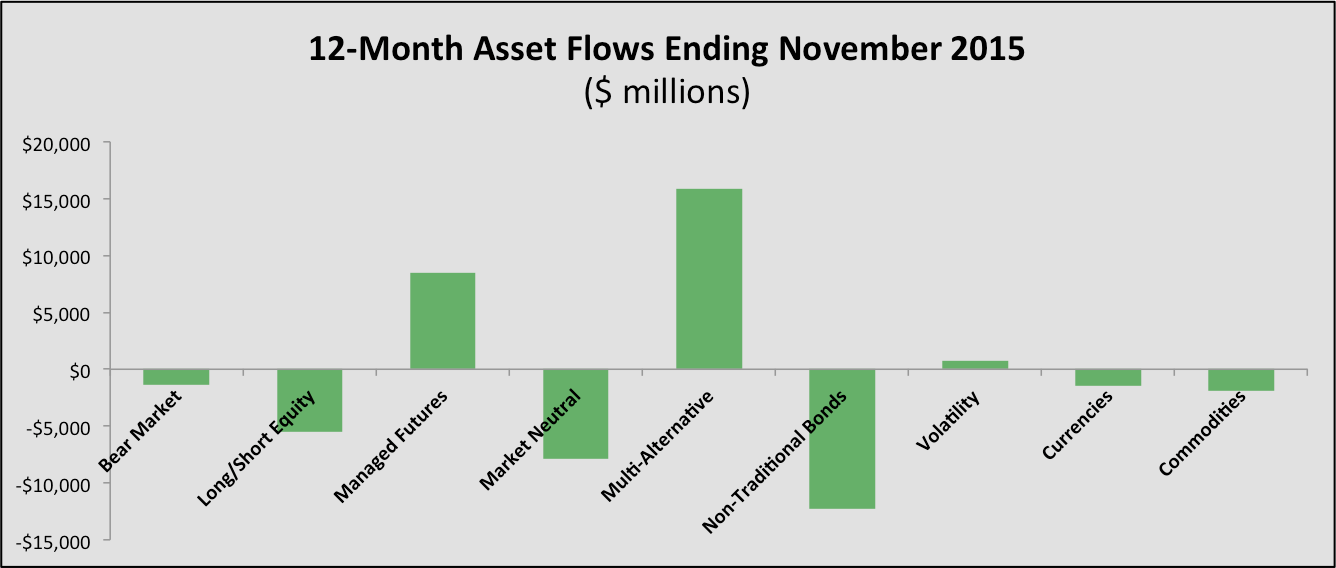
This concentration is not good for the industry, but just as we saw a shift from 2014 to 2015 (non-traditional bond funds were the largest asset gatherer in 2014), the flows will likely shift in 2016. I would expect managed futures to continue to see strong inflows, and both long/short equity and commodities could see a turn back to the positive.

Hot Topics

While there have been a slew of year-end fund launches (we will cover those next month), a dominant theme coming into the end of the year was fund closures. While the Third Avenue Focused Credit Fund announced an abrupt closure of its mutual fund due to significant outflows, the concentration of asset flows to alternative funds is causing a variety of managers to liquidate funds. Most recently, the hedge fund firm Whitebox Advisors decided to close three alternative mutual funds, the oldest of which was launched in 2011. This is a concerning trend, but reminds us that performance still rules.

On the research front, we published summaries of three important research papers in December, all three of which have been popular with readers:

If you would like to keep up with all the news from DailyAlts, feel free to sign up for our daily or weekly newsletter.

All the best for 2016! Have a happy, safe and prosperous year.

Elevator Talk: Randy Swan, Swan Defined Risk (SDRAX/SDRIX)

elevatorSince the number of funds we can cover in-depth is smaller than the number of funds worthy of in-depth coverage, we have decided to offer one or two managers each month the opportunity to make a 200 word pitch to you. That’s about the number of words a slightly-manic elevator companion could share in a minute and a half. In each case, I’ve promised to offer a quick capsule of the fund and a link back to the fund’s site. Other than that, they’ve got 200 words and precisely as much of your time and attention as you’re willing to share. These aren’t endorsements; they’re opportunities to learn more.

randy swanRandy Swan manages SDRAX, which launched at the end of July 2012. He founded Swan Capital Management, which uses this strategy in their separately managed accounts in 1997. Before then, Mr. Swan was a CPA and senior manager for KPMG’s Financial Services Group, primarily working with insurance companies and risk managers. Mr. Swan manages about $27 million in other accounts, including the new Swan Defined Risk Emerging Markets (SDFAX).

“Stocks for the long term” is an attractive claim, give or take two small problems. First, investors live in the short term; their tolerance for pain is somewhere between three days and three years with most sitting toward the shorter end of that range. Second, sharp losses in the short term push the long-term further off; many of the funds that suffered 50% losses in the 2007-09 debacle remain underwater seven years later.

Bright investors know both of those things and try to hedge their portfolios against risk. The questions become (1) what risk do you try to hedge out? and (2) what tools do you choose? The answers include “everything conceivable and several inconceivable risks” and “balanced portfolios” to “expensive, glitch, inexplicably complicated black box schemes.”

Mr. Swan’s answers are (1) the risk of grinding bear markets but not short-term panics and (2) cheap, value-oriented equity exposure and long-dated options. The strategy is, he says, “always invested, always hedged.”

It’s nice to note that the strategy has outperformed both pure equity and balanced strategies, net of fees, since inception. $10,000 invested with Swan in 1997 has now grown to roughly $44,000 while a comparable investment in the S&P500 climbed to $30,300 and a balanced portfolio would have reached $25,000. I’m more struck, though, by the way that Swan generated those returns. The graphic below compares the variability in returns of the S&P and Swan’s strategy over the nearly 19 years he’s run the strategy. Each line represents the performance for one 10-year period (1998-2007, 1999-2008 and so on).

swan chart

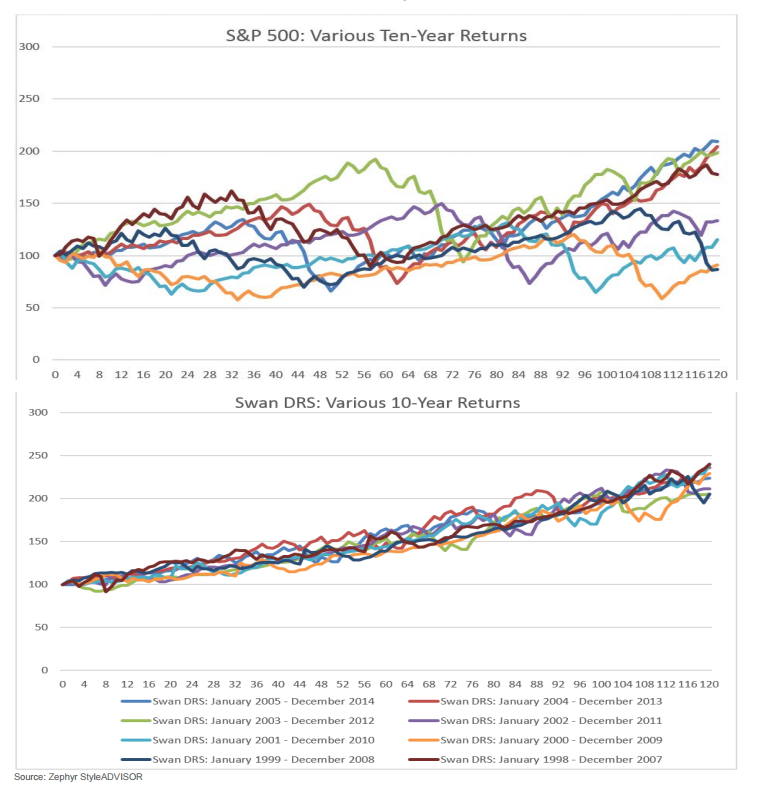
The consistency of Swan’s returns are striking: in his worst 10-year run, he averaged 7.5% annually while the best run generated 9%. The S&P returns are, in contrast, highly variable, unpredictable and lower.

Here are Mr. Swan’s 222 words on why you should add SDRAX to your due-diligence list:

We’ve managed this strategy since 1997 as a way of addressing the risks posed by bear markets. We combine tax-efficient, low-cost exposure to the U.S. stock market with long-dated options that protect against bears rather than corrections. We’re vulnerable to short-term declines like August’s correction but we’ve done a great job protecting against bears. That’s a worthwhile tradeoff since corrections recover in months (August’s losses are pretty much wiped out already) but bears take years.

Most investors try to manage risk with diversification but you can’t diversify market risk away. Instead, we choose to directly attack market risk by including assets that have an inverse correlation to the markets. At the same time, we maintain a stock portfolio that equally weights all nine sectors through the Select SPDR ETFs which we rebalance regularly. In the long-term, all of the research we’ve seen says an equal-weight strategy will outperform a cap-weighted one because it forces you to continually buy undervalued sectors. That strategy underperforms at the end of a bull market when index gains are driven by a handful of momentum-driven stocks, but over full market cycles it pays off.

Our maxim is KISS: keep it simple, stupid. Low-cost market exposure, reliable hedges against bear markets, no market timing, no attempts at individual security selection. It’s a strategy that has worked for us.

The fund lost about 4% in 2015. Over the past three years, the fund has returned 5.25% annually, well below the S&P 500’s 16%. With the fund’s structural commitment to keeping 10% in currently-loathed sectors such as energy, utilities and basic materials, that’s neither surprising nor avoidable.

Swan Defined-Risk has a $2500 minimum initial investment on its “A” shares, which bear a sales load, and $100,000 on its Institutional shares, which do not. Expenses on the “A” shares run a stiff 1.58% on assets of $1.4 billion, rather below average, while the institutional shares are 25 basis points less. Load-waived access to the “A” shares is available through Schwab, Fidelity, NFS, & TD Ameritrade. Pershing will be added soon.

Here’s the fund’s homepage. Morningstar also wrote a reasonably thoughtful article reflecting on the difference in August 2015 performance between Swan and a couple of apparently-comparable funds. A second version of the article features an annoying auto-launch video.

Funds in Registration

There are 14 new no-load funds in the pipeline. Most will be available by late February or early March. While the number is not extraordinarily high, their parentage is. This month saw filings on behalf of American Century (three funds), DoubleLine, T. Rowe Price (three) and Vanguard (two).

The most intriguing registrant, though, is a new fund from Seafarer. Seafarer Overseas Value Fund will invest in an all-cap EM stock portfolio. Beyond the bland announcement that they’ll use a “value” approach (“investing in companies that currently have low or depressed valuations, but which also have the prospect of achieving improved valuations in the future”), there’s little guidance as to what the fund’s will be doing.

The fund will be managed by Paul Espinosa. Mr. Espinosa had 15 years as an EM equity analyst with Legg Mason, Citigroup and J.P. Morgan before joining Seafarer in May, 2014. Seafarer’s interest in moving in the direction of a value fund was signaled in November, with their publication of Mr. Espinosa’s white paper entitled On Value in the Emerging Markets. It notes the oddity that while emerging markets ought to be rife with misvalued securities, only 3% of emerging markets funds appear to espouse any variety of a value investing discipline. That might reflect Andrew Foster’s long-ago observer that emerging markets were mostly value traps, where corporate, legal and regulatory structures didn’t allow value to be unlocked. More recently he’s mused that those circumstances might be changing.

In any case, after a detailed discussion of what value investing might mean in the emerging markets, the paper concludes:

This exploration discovered a large value opportunity set with an aggregate market capitalization of $1.4 trillion, characterized by financial metrics that strongly suggest the pervasive presence of discounts to intrinsic worth.

After examining most possible deterrents, this study found no compelling reason that investors would forgo value investing in the emerging markets. On the contrary, this paper documented a potential universe that was both large and compelling. The fact that such an opportunity set remains largely untapped should make it all the more attractive to disciplined value practitioners.

The initial expense ratio has not yet been set, though Seafarer is evangelical about providing their services at the lowest practicable cost to investors, and the minimum initial investment is $2,500.

Manager Changes

Fifty-six funds saw partial or complete turnover in their management teams in the past month. Most of the changes seemed pretty modest though, in one case, a firm’s president and cofounder either walked out, or was shown, the door. Curious.

Updates

Back in May, John Waggoner took a buyout offer from USA Today after 25 years as their mutual funds guru. Good news: he’s returning to join InvestmentNews as a senior contributor and mutual funds specialist. Welcome back, big guy!

Briefly Noted . . .

At a Board meeting held on December 11, 2015, RiskX Investments, LLC (formerly American Independence Financial Services, LLC), the adviser to the RX Dynamic Stock Fund (IFCSX formerly, the American Independence Stock Fund), recommended to the Trustees of the Board that the Fund change its investment strategy from value to growth. On whole, that seems like a big honkin’ shift if you were serious about value in the first place but they weren’t: the fund’s portfolio – which typically has a turnover over 200% a year – shifted from core to value to core to value to growth over five consecutive years. That’s dynamic!

SMALL WINS FOR INVESTORS

“The closure of the 361 Managed Futures Strategy Fund (AMFQX) to investment by new investors that was disclosed by the Fund in Supplements dated September 9, 2015, and September 30, 2015, has been cancelled.” Well, okay then!

On December 31st, Champlain Emerging Markets Fund (CIPDX) announced that it was lowering its expense ratio from 1.85% to 1.60%. With middle-of-the-road performance and just $2 million in assets, it’s worth trying.

It appears that AMG Frontier Small Cap Growth Fund (MSSGX) and AMG TimesSquare Mid Cap Growth Fund (TMDIX) reopened to new investors on January 1. Their filings didn’t say that they reopening; they said, instead, that “With respect to the sub-section ‘Buying and Selling Fund Shares’ in the section ‘Summary of the Funds’ for the Fund, the first paragraph is hereby deleted in its entirety.” The first paragraph explained that the funds were soft-closed.

Effective January 1, ASTON/Cornerstone Large Cap Value Fund (RVALX) will reduce its expense ratio from 1.30% to 1.14% on its retail shares. Institutional shares will see a comparable drop.

Effective as of February 1, 2016, the Columbia Acorn Emerging Markets Fund (CAGAX) and Columbia Small Cap Growth Fund (CGOAX) will be opened to new investors and new accounts.

Effective January 1, 2016, Diamond Hill reduced its management fee for the four-star Diamond Hill Large Cap Fund (DHLAX) from an annual rate of 0.55% to 0.50%.

Effective immediately, the minimum initial investment requirements for the Class I Shares of Falcon Focus SCV Fund (FALCX) are being lowered to $5,000 for direct regular accounts and $2,500 for direct retirement accounts, automatic investment plans and gift accounts for minors.

Here’s why we claim to report nothing grander than “small wins” for investors: the board of Gotham Absolute 500 Fund (GFIVX) has graciously agreed to reduce the management fee from 2.0% to 1.5% and the expense cap from 2.25% to 1.75%. All of this on an institutional long/short fund with high volatility and a $250,000 minimum. The advisor calculates that it actually costs them 5.42% to run the fund. The managers both have over $1 million in each of their four funds.

Grandeur Peak has reduced fees on two of its funds. Grandeur Peak Emerging Markets Opportunities Fund (GPEOX) to 1.95% and 1.70% and Grandeur Peak Global Reach Fund (GPGRX) to 1.60% and 1.35%.

Effective January 4, 2016, Royce Premier Fund (RYPRX) and Royce Special Equity Fund (RYSEX) will reopen to new shareholders. Why, you ask? Each fund’s assets have tumbled by 50% since 2013 as Premier trailed 98% of its peers and Special trailed 92%. Morningstar describes Special as “a compelling small-cap option” and gives it a Gold rating.

Teton Westwood Mid-Cap Equity Fund (WMCRX) has reduced the expense cap for Class I shares of the Fund to 0.80%.

CLOSINGS (and related inconveniences)

Effective as of the close of business on December 31, 2015, Emerald Growth Fund (HSPGX) closed to new investors

The Class A shares of Hatteras Managed Futures Strategies Fund were liquidated in mid-December. The institutional class (HMFIX) remains in operation for now. Given that there’s a $1 million minimum initial investment and far less than $1 million in assets in the fund, I suspect we’ll continue thinning out of liquid-alts category soon.

Effective as of the close of business on January 28, 2016, Vontobel International Equity Institutional (VTIIX) and Vontobel Global Equity Institutional Fund (VTEIX) will soft close. Given that the funds have only $30 million between them, I suspect that they’re not long for this world. 

OLD WINE, NEW BOTTLES

At the end of February, Aberdeen Small Cap Fund (GSXAX) becomes Aberdeen U.S. Small Cap Equity Fund. Two bits of good news: (1) it’s already a very solid performer and (2) it already invests 93% of its money in U.S. small cap equities, so it’s not likely that that’s going to change. At the same time, Aberdeen Global Small Cap Fund (WVCCX) will become Aberdeen International Small Cap Fund. The news here is mixed: (1) the fund kinda sucks and (2) it already invests more than 80% of its money in international small cap equities, so it’s not likely that that’s going to change either.

Sometime in the first quarter of 2016, Arden Alternative Strategies Fund (ARDNX) becomes Aberdeen Multi-Manager Alternative Strategies Fund, following Aberdeen’s purchase of Arden Asset Management.

Effective on February 1, 2016: AC Alternatives Equity Fund, which hasn’t even launched yet, will change its name to AC Alternatives Long Short Fund. After the change, the fund will no longer be required to invest at least 80% of its portfolio in equities.

As of February 27, 2016, Balter Long/Short Equity Fund (BEQRX) becomes Balter L/S Small Cap Equity Fund.

At an as-yet unspecified date, Capital Innovations Global Agri, Timber, Infrastructure Fund (INNAX) will become RidgeWorth Capital Innovations Global Resources and Infrastructure Fund. Interesting little fund, the subject of an Elevator Talk several months ago.

Gator Opportunities Fund (GTOAX) is on its way to becoming BPV Small Cap Fund, likely by the beginning of summer, 2016. The fund will shed its mid-cap holdings in the process.

At the end of January 2016, Marsico Growth FDP Fund (MDDDX) will become FDP BlackRock Janus Growth Fund. Which is to say, yes, Marsico lost another sub-advisory contract.

Effective December 31, 2015, the Meeder Strategic Growth Fund (FLFGX) changed its name to Global Opportunities Fund.

On February 24, 2016, the T. Rowe Price Diversified Small-Cap Growth Fund (PRDSX) will change its name to the T. Rowe Price QM U.S. Small-Cap Growth Equity Fund. The addition of “QM” in the fund’s name reflects the concept that the fund employs a “quantitative management” strategy.

On March 1, Transamerica Asset Management will make a few tweaks to Transamerica Growth Opportunities (ITSAX). The managers will change (from Morgan Stanley to Alta Capital); likewise the “fund’s investment objective, principal investment strategies, principal risks, benchmark index, portfolio managers [and] name, will change. The fund will also have a lower advisory fee schedule.” The reborn fund will be named Transamerica Multi-Cap Growth.

Effective January 31, 2016, the principal investment strategy of Turner Emerging Growth Fund (TMCGX) shifts from focusing on “small and very small” cap stocks to “small and mid-cap” ones. The fund will also change its name to the Turner SMID Cap Growth Opportunities Fund

OFF TO THE DUSTBIN OF HISTORY

All Terrain Opportunity Fund (TERAX) liquidated on December 4, 2015. Why? It was only a year old, had $30 million in assets and respectable performance.

Big 4 OneFund (FOURX) didn’t make it to the New Years. The fund survived for all of 13 months before the managers despaired for the “inability to market the Fund.” It was a fund of DFA funds (good idea) which lost 12% in 12 months and trailed 94% of its peers. One wonders if the adviser should have ‘fessed up the “the inability to manage a fund that was worth buying”?

BPV Income Opportunities Fund liquidated on December 22, 2015, on about a week’s notice.

The Board of Trustees of Natixis Funds determined that it would be in the best interests of CGM Advisor Targeted Equity Fund (NEFGX) that it be liquidated, which will occur on February 17, 2016. Really, they said that: “it’s in the fund’s best interests to die.” The rest of the story is that CGM is buying itself back from Natixis; since Natixis won’t accept outside managers, the fund needed either to merge or liquidate. Natixis saw no logical place for it to merge, so it’s gone.

C Tactical Dynamic Fund (TGIFX) liquidated on December 31, 2015.

Clinton Long Short Equity Fund (WKCAX) liquidates on January 8, 2016.

Columbia has proposed merging away a half dozen of its funds, likely by mid-2016 though the date hasn’t yet been settled.

Acquired Fund Acquiring Fund
Columbia International Opportunities Columbia Select International Equity
Columbia International Value Columbia Overseas Value
Columbia Large Cap Growth II, III, IV and V Columbia Large Cap Growth
Columbia Multi-Advisor Small Cap Value Columbia Select Smaller-Cap Value
Columbia Value and Restructuring Columbia Contrarian Core

On or about March 31, 2016, the ESG Managers Growth Portfolio (PAGAX) will be consolidated into the ESG Managers Growth and Income Portfolio (PGPAX), which will then be renamed Pax Sustainable Managers Capital Appreciation Fund. At the same time, ESG Managers Balanced Portfolio (PMPAX) will be consolidated into the ESG Managers Income Portfolio (PWMAX) which will then be known as Pax Sustainable Managers Total Return Fund. The funds are all sub-advised by Morningstar staff.

Fortunatus Protactical New Opportunity Fund (FPOAX) liquidated on December 31, 2015. Why? The fund launched 12 months ago, had respectable performance and had drawn $40 million in assets. Perhaps combining the name of a 15th century adventurer (and jerk) with an ugly neologism (protactical? really?) was too much to bear.

Foundry Small Cap Value Fund liquidated on December 31, 2015.

Frost Cinque Large Cap Buy-Write Equity Fund (FCBWX) will cease operations and liquidate on or about February 29, 2016.

The tiny, one-star Franklin All Cap Value Fund (FRAVX), a fund that’s about 60% small caps, is slated to merge with huge, two-star Franklin Small Cap Value Fund (FRVLX), pending shareholder approval. That will likely occur at the beginning of April.

Back in 2008, if you wanted to pick a new fund that was certain to succeed, you’d have picked GRT Value. It combined reasonable expenses, a straightforward discipline and the services of two superstar managers (Greg Frasier, who’d been brilliant at Fidelity Diversified International and Rudy Kluiber who beat everyone as manager of State Street Research Aurora). Now we learn that GRT Value Fund (GRTVX) and GRT Absolute Return Fund (GRTHX) will liquidate on or about January 25, 2016. What happened? Don’t know. The fund rocketed out of the gate then, after two years, began to wobble, then spiral down. Both Value and its younger sibling ended up as tiny, failed shells. Perhaps the managers’ attention was riveted on their six hedge funds or large private accounts? Presumably the funds’ fate was sealed by GRT’s declining business fortunes. According to SEC filing, the firm started 2015 with $950 million in AUM, which dropped by $785 million by June and $500 million by September. The declining size of their asset base was accompanied by a slight increase in the number of accounts they were managing, which suggests the departure of a few major clients and a scramble to replace them with new, smaller accounts.

The folks behind the Jacobs/Broel Value Fund (JBVLX) have decided to liquidate the fund based on “its inability to market the Fund and the Adviser’s indication that it does not desire to continue to support the Fund.” Nearly all of the assets in the fund are the managers’ own money, perhaps because others wondered about paying 1.4% for:

jbvlx

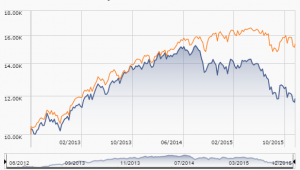
The fund will liquidate on January 15, 2016.

On or around January 28, 2016, JOHCM Emerging Markets Small Mid Cap Equity Fund Service Class shares (JOMIX) will liquidate.

The Board of Directors of the Manning & Napier Fund, Inc. has voted to completely liquidate the Focused Opportunities Series (MNFSX) on or about January 25, 2016.

HSBC Growth Fund (HOTAX) will cease its investment operations and liquidate on or about February 12, 2016. Apparently the combination of consistently strong results with a $78 million asset base was not compelling.

McKinley Diversified Income Fund (MCDRX) is merging with Innovator McKinley Income Fund (IMIFX), pending shareholder approval. The reorganization will occur January 29, 2016.

Leader Global Bond Fund (LGBMX) will close, cease operations, redeem all outstanding shares and liquidate, all on January 29, 2016.

Madison Large Cap Growth Fund (MCAAX) merges with and into the Madison Investors Fund (MNVAX) on February 29, 2016. The Board mentions the identical objectives, strategies, risk profile and management as reason for why the merger is logical.

The Newmark Risk-Managed Opportunistic Fund (NEWRX) liquidated on December 31, 2015. The Board attributed the decision to the fund’s small size, rather than to the underlying problem: consistently bad short- and long-term performance.

Nile Frontier and Emerging Fund (NFRNX) liquidated, on about three weeks’ notice, on December 31, 2015.

QES Dynamic Fund (QXHYX) liquidated on December 17, 2015, after a week’s notice.

On January 29, 2016, Redmont Resolute Fund I (RMREX) becomes Redmont Dissolute Fund as it, well, dissolves.

Royce has now put the proposals to merge Royce European Small-Cap Fund (RESNX) and Global Value (RIVFX) into Royce International Premier Fund (RYIPX) to their shareholders. The proposal comes disturbingly close to making the argument that, really, there isn’t much difference among the Royce funds. Here is Royce’s list of similarities:

  • the same objective;
  • the same managers;
  • the same investment approach;
  • the same investment universe, small-cap equities;
  • the same sort of focused portfolio;
  • all provide substantial exposure to foreign securities;
  • the same policy on hedging;
  • the same advisory fee rates;
  • the same restrictions on investments in developing country securities; and
  • almost identical portfolio turnover rates.

Skeptics have long suggested that that’s true of the Royce funds in general; they have pretty much one or two funds that have been marketed in the guise of 20 distinct funds.

Third Avenue Focused Credit Fund (TFCVX) nominally liquidated on December 9, 2015. As a practical matter, cash-on-hand was returned to shareholders and the remainder of the fund’s assets were placed in a trust. Over the next year or so, the adviser will attempt to find buyers for its various illiquid holdings. The former fund’s shareholders will receive dribs and drabs as individual holdings are sold “at reasonable prices.”

Valspresso Green Zone Select Tactical Fund liquidated on December 30, 2015.

On December 2, 2015, Virtus Disciplined Equity Style, Virtus Disciplined Select Bond and Virtus Disciplined Select Country funds were liquidated.

Whitebox is getting out of the mutual fund business. They’ve announced plans to liquidate their Tactical Opportunities (WBMAX), Market Neutral Equity (WBLSX) and Tactical Advantage (WBIVX) funds on or about January 19, 2016.

In Closing . . .

In case you sometimes wonder, “Did I learn anything in the past year?” Josh Brown offered a great year-end compendium of observations from his friends and acquaintances, fittingly entitled “In 2015, I learned that …” Extra points if you can track down the source of “Everything’s amazing and nobody’s happy.”

And as for me, thanks and thanks and thanks! Thanks to the 140 or so folks who’ve joined MFO Premium as a way of supporting everything we’re doing. Thanks to the folks who’ve shared books, both classic (Irrational Exuberance, 3e) and striking (Spain: The Centre of the World, 1519-1682) and chocolates. I’m so looking forward to a quiet winter’s evening to begin them. Thanks to the folks who’ve read us and written to us, both the frustrated and the effusive. Thanks to my colleagues, Charles, Ed and Chip, who do more than I could possibly deserve. Thanks to the folks on the discussion board, who keep it lively and civil and funny and human. Thanks to the folks who’ve volunteered to help me learn to be halfway a businessperson, Sisyphus had it easier.

And thanks, especially, to all of you who’ll be here again next month.

We’ll look for you.

David

Funds in registration, January 2016

By David Snowball

American Century Global Small Cap Fund

American Century Global Small Cap Fund will seek capital growth. The plan is “to use a variety of analytical research tools and techniques to identify the stocks of companies that meet their investment criteria.” Not a word about what those criteria might be, though they espouse the same bottom-up, follow the revenue language as the other two AC funds listed below. The fund will be managed by Trevor Gurwich and Federico Laffan; they also manage American Century International Opportunities (AIOIX) together. The initial expense ratio will be 1.51% and the minimum initial investment is $2,500.

American Century Emerging Markets Small Cap Fund

American Century Emerging Markets Small Cap Fund will seek capital growth. The plan is to invest in small EM companies based on the conviction that “over the long term, stock price movements follow growth in earnings, revenues and/or cash flow.” The fund will be managed by Patricia Ribeiro who has been managing American Century Emerging Markets (TWMIX) since 2006. The initial expense ratio will be 1.61% and the minimum initial investment is $2,500.

American Century Focused International Growth Fund

American Century Focused International Growth Fund will seek capital growth. The plan is to construct a bottom-up portfolio of 35-50 firms whose revenues are growing at an accelerating pace. The fund will be managed by Rajesh Gandhi and James Gendelman. Mr. Gendelman is, dare I say, a refugee from The House of Marsico. The initial expense ratio will be 1.24% and the minimum initial investment is $2,500.

Canterbury Portfolio Thermostat Fund

Canterbury Portfolio Thermostat Fund will seek long-term risk-adjusted growth. The plan is to use ETFs to invest in all the right places given current market conditions. The strategy is executed through ETFs and is unrelated to the much simpler, highly successful Columbia Thermostat fund discipline. The fund will be managed by Thomas Hardin and Kimberly J. Custer. The initial expense ratio will be 2.18% and the minimum initial investment is $5,000 for Institutional shares and $2,500 for Investor ones.

DoubleLine Infrastructure Income Fund

DoubleLine Infrastructure Income Fund will seek current income and total return. The plan is to invest in fixed- and floating-rate instruments which are being used to finance or refinance infrastructure projects globally. In general, the portfolio will be dollar-denominated. The fund will be managed by a team of DoubleLine folks, none of whom is named Jeffrey. The initial expense ratio has not yet been set and the minimum initial investment is $2,000, reduced to $500 for IRAs.

Manning & Napier Managed Futures

Manning & Napier Managed Futures  will seek positive absolute returns. “Managed futures” is a brilliant strategy with a horrendous track record: divide the world up into a series of asset classes, then use futures to invest long in rising classes, short falling ones and use the bulk of your assets to buy short-term bonds to add a bit of income. The strategy has lost money steadily over the past five years as the market has refused to cooperate by providing predictable trends to exploit. Over much longer periods, managed futures indexes have provided near-equity returns with reduced volatility. The fund will be managed by a team from M&N. The initial expense ratio will be 1.40% and the minimum initial investment is $2,000.

Pax World Mid Cap Fund

Pax World Mid Cap Fund will seek long-term growth of capital. The plan is to follow “a sustainable investing approach, combining rigorous financial analysis with equally rigorous environmental, social and governance analysis in order to identify investments.” The fund will be managed by Nathan Moser who also manages Pax World Small Cap (PXSAX). That fund has been a pretty solid performer pretty consistently. The initial expense ratio will be 1.24% and the minimum initial investment is $1000.

Seafarer Overseas Value Fund

Seafarer Overseas Value Fund will seek long-term capital appreciation. The plan is to invest in an all-cap EM stock portfolio. Beyond the bland announcement that they’ll use a “value” approach (“investing in companies that currently have low or depressed valuations, but which also have the prospect of achieving improved valuations in the future”), there’s little guidance as to what the fund’s will be doing. The fund will be managed by Paul Espinosa. Mr. Espinosa had 15 years as an EM equity analyst with Legg Mason, Citigroup and J.P. Morgan before joining Seafarer in May, 2014. The initial expense ratio has not yet been set, though Seafarer is evangelical about providing their services at the lowest practicable cost to investors, and the minimum initial investment is $2,500.

T. Rowe Price QM Global Equity Fund

T. Rowe Price QM Global Equity Fund will seek long-term growth of capital through a broadly diversified portfolio of global stocks. The plan is to use quantitative models (the “QM”) to select mid- to large-cap stocks based on “valuation, profitability, stability, management capital allocation actions, and indicators of near term appreciation potential.” The fund will be managed by Sudhir Nanda, head of TRP’s Quantitative Equity group. Dr. Nanda, formerly Professor Nanda, joined Price in 2000 and has managed the five-star Diversified Small Cap Growth fund (PRDSX) for the past nine years. The initial expense ratio will be 0.79% and the minimum initial investment is $2,500, though that’s reduced to $1000 for various sorts of tax-advantaged accounts.

T. Rowe Price QM U.S. Small & Mid-Cap Core Equity Fund

T. Rowe Price QM U.S. Small & Mid-Cap Core Equity Fund will seek long-term growth of capital through a broadly diversified portfolio of small- and mid-cap U.S. stocks. The plan is to use quantitative models (the “QM”) to select small- to mid-cap stocks, comparable to those covered by the Russell 2500, based on “valuation, profitability, stability, management capital allocation actions, and indicators of near term appreciation potential.” Up to 20% might be international stocks, but that disclosure seems mostly a formality. The fund will be managed by Boyko Atanassov, a quantitative equity analyst with Price for the past five years. The initial expense ratio will be 0.89% and the minimum initial investment is $2,500, though that’s reduced to $1000 for various sorts of tax-advantaged accounts.

T. Rowe Price QM U.S. Value Equity Fund

T. Rowe Price QM U.S. Value Equity Fund will seek long-term growth of capital through a broadly diversified portfolio of U.S. stocks believed to be undervalued. The plan is to screen firms based on “valuation, profitability, stability, management capital allocation actions, and … near term appreciation potential,” then assess their valuations based on price-to-earnings, price-to-cash flows, and price-to-book ratios, and compares these ratios with others in the relevant investing universe. The fund will be managed by Farris Shuggi, a Price quantitative equity analyst with three master’s degrees. The initial expense ratio will be 0.74% and the minimum initial investment is $2,500, though that’s reduced to $1000 for various sorts of tax-advantaged accounts.

Templeton Dynamic Equity Fund

Templeton Dynamic Equity Fund will seek risk adjusted total return over the longer term. The whimsical plan is to use a “bottom-up, value-oriented, long-term approach” to select individual equities then use a long/short ETF portfolio to manage sector exposures and hedge its global market exposure with some combination of cash, ETFs and futures. The technical term for this strategy is “a lot of moving parts.” The fund will be managed by a Templeton team: James Harper, Norman J. Boersma, and Heather Arnold.  “A” shares have a 5.75% front load, a $1000 minimum and a 1.57% initial e.r. “Advisor” shares are no-load with a 1.32% e.r. “R” shares are no-load but impose a 0.50% 12(b)1 fee for a total e.r. of 1.82%.

Vanguard Core Bond

Vanguard Core Bond will seek to provide total return while generating a moderate level of current income. The plan is to invest in all different sorts of bonds with very little guidance in the prospectus about which or why, other than to target an average maturity of 4-12 years and to limit non-dollar-denominated bonds to 10% of the portfolio. At base, this looks like Vanguard’s attempt to generate an active fund that’s just slightly more attractive than a broad bond market index. The fund will be managed by Brian W. Quigley, Gemma Wright-Casparius, and Gregory S. Nassour, all of Vanguard. The initial expense ratio will be 0.25% on Investor shares and the minimum initial investment is $3000.

Vanguard Emerging Markets Bond

Vanguard Emerging Markets Bond will seek to provide total return while generating a moderate level of current income. The plan is to invest in all sorts of EM bonds, including high yield. For their purposes, the emerging markets are everybody except Australia, Canada, Japan, New Zealand, the United States, the United Kingdom, and most European Monetary Union countries.  In general, they’ll buy bonds which are “denominated in or hedged back to the U.S. dollar.” The fund will be managed by Daniel Shaykevich, who has been with Vanguard for three years and co-leads their Investment Grade Non-Corporate team. Before joining Vanguard he spent almost nine years as an EM bond manager for BlackRock. The initial expense ratio will be 0.60% and the minimum initial investment is $3000.

December 1, 2015

By David Snowball

Dear friends,

I’ve been reading two strands of research lately. One shows that simple expressions of gratitude and acts of kindness have an incredibly powerful effect on your mental and physical health. Being consciously grateful of the goodness in your life, for example, carries most of the same benefits of meditation without the need for … well, sitting on the floor and staring at candle flames. The other shows that people tend to panic when you express gratitude to them gratitudeor try to do kind things for them. Apparently giving money away to strangers is a lot harder than you’d imagine.

The midwinter holidays ahead – not just Christmas but a dozen other celebrations rooted in other cultures and other traditions – are, at base, expressions of gratitude. They occur in the darkest, coldest, most threatening time of year. They occur at the moment when we most need others, and they most need us. No one thrives when they’re alone and each day brings 14 to 18 hours of darkness. And so we’ve chosen, from time immemorial, to open our hearts and our homes, our arms and our pantries, to friends and strangers alike.

Don’t talk yourself out of that impulse. Don’t worry about whether your gift is glittery (if people actually care about that, you’re sharing gifts with the wrong people) or your meal is perfect (Martha Stewart’s were and she ended up in the Big House). People most appreciate gifts that make them think of you; give a part of yourself. Follow the Grinch. Take advice from Scrooged. Tell someone they make you smile, hug them if you dare, smile and go.

Oh, by the way, you make me smile. I’m endlessly humbled (and pleased) at the realization that you’re dropping by to see what we’ve been thinking. Thanks for that!

Built on failure

Success is not built on success. It’s built on failure. It’s built on frustration. Sometimes it’s built on catastrophe. Sumner Redstone (2007)

My dad never had much tolerance of failure. Perhaps because he’d experienced more than his share. Perhaps because he judged people so harshly and assumes that others did the same to him. No matter. For him, a failed project was the sign of a failed person. And so we learned to keep our heads down, volunteer nothing, risk nothing, and never fail.

And, at the same time, we never succeeded. “In order to succeed, you have to live dangerously,” Mr. Redstone advised. The notion of taking risks came late and hesitantly.

I wish I’d risked more and failed more, perhaps even failed more joyfully. But I’m working on it. You should, too. Being comfortable with failure is good; it means that you’re less likely to sabotage yourself through timidity. It’s a human resources truism that a guy with 10% of the necessary qualifications for a job will apply for it. A woman with 90% of the qualifications will not. Both ask themselves the same question, “what’s the worst that could happen?” but give themselves strikingly different answers. Talking comfortably about failure is better; it means that you’re removing the terror from other’s minds, enabling them to take the risks that might lead to failure but that are also essential for success. You should practice both. There’s also some interesting research that suggests that people who think of themselves as “experts” get all puffed up, then become rigid and dogmatic. That’s hardly a recipe for success.

The Wall Street Journal recently published “How not to flunk at failure,” (10/25/2015) by John Danner and Mark Coopersmith. Both are faculty at UC-Berkeley’s Haas School of Business. They’ve co-authored The Other “F” Word: How Smart Leaders, Teams, and Entrepreneurs Put Failure to Work (2015). They argue that it’s more common to fail poorly than to fail well because we so horrified at the notion that we failed at all. As a result, we feel sick and learn nothing.

They offer four recommendations for failing well.

  1. The first step: admit you’ve had failures yourself. The guys who growl that “failure is not an option” end up, they say, creating a culture of “trial and terror” rather than a healthy culture of “trial and error.”
  2. Ask the right questions when the inevitable failure occurs. Abandon the witch hunt that begins with the question “who was responsible?” Instead, think “hmmm, that was the damnedest thing” and begin exploring it with the sorts of who, what, why, where, when questions familiar to journalists.
  3. Borrow a page, or at least a term, from the lab. Stop talking in excited terms about mission-critical strategic imperatives and start talking about experiments. Experiments are just a tool, a means to learn something. Sometimes we learn the most when an experiment does something utterly freakish. “We’ll try this as an experiment, see what comes of it and plan from there” involves less psychological commitment and more distance.
  4. Make the ending count. Your staff needs your support much less when things go right than when they go wrong. You need to celebrate the end of an experiment that went poorly with at least as much ceremony as you do when one went well. “Well, that Why don’t I take you out for a nice dinner and we’ll figure out what we’ve learned and where we go from here,” would be a spectacularly good use of your time and the corporate credit card.

Nice article. I can’t link directly to it but if you Google the title, the first result will be the article and you’ll be able to get it. (Alternately, you might, like me, subscribe to the newspaper and simply open it in your browser.)

We’ve tried a bunch of things that have failed and have learned a lot from them. Three stand out.

  1. I suck as a stock investor. Suck, suck, suck. I tried it for a few years. Subscribed to Morningstar Stock Investor. Read Value Line reports. Looked carefully through three years of annual reports. Bought only deeply discounted stocks with viable business models and good managers. I still ended up owning WorldCom (which went to zero) and a bunch of stocks that inexplicably refused to go up. Ended up selling the lot of them, booking a useful tax loss and shifting the money to a diversified fund.

    What I learned was that I’m temperamentally unsuited to stock investing. Having spent months researching an investment, I expect it to do something. As in good! And now! When they staggered about like drunken sailors, I kept feeling the pressure to do something myself. That’s always a losing proposition. And I learned that a few thousand dollars in a fund bought you much better diversification than a few thousand dollars in individual securities.

  2. The Best of the Web isn’t very good. You’ll find it, covered with cobwebs, under “The Best” tab up there at the top right of the screen. Our plan was to sort through a bunch of web-based resources – from fund screeners to news sources – so that you didn’t have to. It’s a worthy project give or take the cobwebs and the occasional references you might find there to President Grover Cleveland’s recent initiatives.

    What I learned was that there are limits to what we can do well. The number of hours it took to review 30 or 40 news sites or to assess the research behind various firms fund ratings, even with a former colleague doing a lot of the legwork, was enormous. The additional time to review and edit drafts was substantial. The gain to our readers was not. We’ve become much more canny about asking the hard “but then what will we stop doing?” question as we consider innovations that add to the 100 hour a month workload that many of us already accept.

  3. The Utopia Funds profile was a disaster. This dates back eight years to our FundAlarm days and it still makes me wince whenever I think of it. Utopia Funds were launched by a small firm out of Michigan and I ridiculed them for the presumptuousness of the name. Imagine my surprise to be having a wonderfully pleasant conversation, a week later, to the firm’s CEO and CIO. The funds, arrayed on a risk scale from Growth to Very Conservative, invested in orphan securities: little bits and pieces that were too small to interest large investment houses and that were often underpriced. Bonds in Malaysia, apartments in Milan, microcap stocks in Austin. The CIO had been managing the strategy in separate accounts, was charming and they appealed to many of my biases (small firm, interesting portfolio, reasonable expenses, ultra-low minimum investments). I got enthused, ran two positively fawning pieces about the funds and Zach the lead manager (He’s Zachtastic!) and invested in them for myself and for family. They absolutely imploded in 2008 – Very Conservative was down about 35% by November – and were liquidated with no explanation and very short notice. I felt betrayed by the adviser and like I had betrayed my readers.

    What I learned was caution. My skeptical first reaction was correct but I let it get washed away by the CIO’s passion, attention and well-told tale. I also overlooked the fact that the strategy’s record was generated in separately-managed accounts and that the CIO was delegating day-to-day responsibility to two talented but less-experienced colleagues. Since then, I’ve changed the way I deal with managers. I now write the profile first, based on the data and the public statements on file. I identify things that cannot be ascertained from those sources and then approach the managers with a limited, targeted set of questions. That helps keep me from substituting their narrative for mine. In addition, I’ve become a lot more skeptical of track records generated in vehicles (separate accounts, SICAVs, hedge funds) other than mutual funds; the structural differences between them really matter. In each draft, I try to flag areas of concern and then share them with you. Forcing myself to ask the question “what are the soft spots here” helps maintain a sort of analytic discipline.

    Utopia’s advisers, by the way, are doing well: still in Traverse City at what appears to be a thriving firm that, true to their owner’s vision, uses part of the firm’s profits to fund a charitable foundation. Me, too: I took the proceeds from the redemption and used it to open positions in FPA Crescent (FPACX) and Matthews Asian Growth & Income (MACSX).

It’s okay to fail, if you fail well. I think that the Observer has been strengthened by my many failures and I hope it will continue to be.

For your part, you need to go find your manager’s discussion of his or her failures. Good managers take ownership of them in no uncertain terms; folks from Bridgeway, Oberweis, Polaris and Seafarer have all earned my respect for the careful, thoughtful discussions they’ve offered of their screw-ups and their responses. If you can’t find any discussion of failures, I’d worry. And if your manager is ducking responsibility (mumbly crap about “contingencies not fully anticipated”), dump him.

Speaking of the opportunity to take a risk and succeed (or fail) spectacularly, it’s time to introduce …

MFO Premium, just because “MFO Extra” sounded silly

We are pleased to announce the launch of MFO Premium. We’re offering it as a gesture of thanks to folks who have supported MFO in the past and an incentive for those who have been promising themselves to support us but haven’t quite gotten there. You can gain a year’s access for a contribution of at least $100; if there are firms that would like multiple log-ins, we’d happily talk through a package.

MFO Premium has been in development for more than a year. Its genesis lays in the tools that Charles, Ed and I rely on as we’re trying to make sense of a fund’s track record. We realized early on that the traditional reporting time frames (YTD, 1-, 3-, 5- and 10-year periods) were meaningless at best and seriously misleading at worst since they capture arbitrary periods unrelated to the rhythms of the market. As a result, we made a screener that allowed us to look at performance in up cycles, down cycles and across full cycles. We also concluded that most services have simple-minded risk measurements; while reporting standard deviation and beta are nice, they represent a small and troubled toolkit since they simplify risk down to short-term volatility. As a result, we made a screener that provides six or eight different lens (from maximum drawdown in each measurement period to recovery times, Ulcer indexes and a simple “risk group” snapshot) through which to judge what you’re getting into.

Along the way we added a tool for side-by-side comparisons of individual funds, side-by-side comparisons with ETFs, previews of our works in progress, a slowly-evolving piece on demographic change and the future of the fund world, sample screener runs (mostly recently, resilient small caps and tech funds that might best hold value in an extended bear) and a small discussion area you can use if something is goofed up.

We think it has three special characteristics:

  1. It’s interesting: so far as we can tell, most of this content is not available in the tools available to “normal” folks and it’s stuff we’ve found useful.
  2. It’s evolving: our current suite of tools is slated to expand as we add more functions that we, personally, have needed or wanted. Sam Lee has been meditating upon the subject since his Morningstar days and has ideas about what we might be able to offer, and I suspect you folks do, too.
  3. It’s responsive: we’re trying to make our tools as useful as possible. If you can show us something that would make the site better and if it’s within our capabilities, we’ll likely do it.

To be clear: we are taking nothing away from MFO’s regular site. Not now, not ever. Nothing’s moving behind a paywall. We’re a non-profit and, more particularly, a non-profit that has a long-standing, principled dedication to helping people make sense of their options. If anything, the success of MFO Premium will allow us to expand and strengthen the offerings on MFO itself.

We operate MFO on revenues of a little more than $1,000/month, mostly from our Amazon affiliation. At 25,000 readers, that comes to income of about $0.04 per reader per month. We got two immediate and two longer-term goals for any additional contributions that the premium site engenders:

  1. Pay for the data. Our Lipper data feed, which powers the premium screener and supports our other analyses, costs $1,000/month. That cost goes up if we have more than a couple thousand people using the premium screener, a problem we’re unlikely to face for a while. For the nonce, our first-year contract costs us $12,000.
  2. Pay for design and programming support. As folks point out monthly, our current format – one long scrolling essay – is exceedingly cumbersome. It arose from the days of FundAlarm, where my first monthly “comments and highlights” column was about as long as your annual Christmas letter. Our plan is to switch to a template which makes MFO looks distinctly magazine-like with a table of contents and a series of separate stories and features. At the same time, we’ll continue to look like MFO. We’ve got outside professionals available to customize the template we’ve chosen and to do the design work. We’ve budgeted about $1,500 for that work.

If we end up with 140 contributions, and we’re already half way there, we can cover those expenses and contemplate the two longer-term plans:

  1. Offer some compensation for the folks who write for, do programming for or manage the Observer. Currently our compensation budget in most months is zero.
  2. Expand our efforts to help guide and support independent managers and boutique firms. There are an awful lot of smart, talented people out there who are working in splendid isolation from one another. We suspect that helping small fund advisers find ways to exchange thoughts and share angst might well make a difference in the breadth and quality of services that other folks receive.

Three final questions that have come up: (1) What if I’ve already contributed this year? In response to a frequently asked question, we’ve kept track of all of the folks who’ve already contributed to the Observer this year. You’re not getting left behind but it may take a couple weeks for us to catch up with you. (2) Is my contribution tax-deductible? Melissa, our attorney, has been very stern with me about how I’m allowed to answer this question so I’ll let her answer it.

Contributions are tax-deductible to the extent allowable under law. In accordance with IRS regulations, the fair market value of the online premium access of $15 is not tax-deductible. MFO is not confirming or guaranteeing that any donor can take charitable deductions; no nonprofit can do that since it depends on the individual donor’s tax situation. For example, donors can only take the deduction if they itemize and donors are subject to certain AGI limits. The nonprofit can only state that it is a 501(c)(3) organization and contributions may be tax-deductible under the law.

(3) Is there an alternative to using PayPal? Well, yes. PayPal is the default. But you do not need a PayPal account. We just use the secure PayPal portal, which allows credit or debit card payment methods. Alternately, writing a check works: Mutual Fund Observer, Inc., 5456 Marquette Street, Davenport, IA 52806. (Drop us an email when the check is in the mail and we will access you pronto.) We’re also working to activate an Amazon Pay option.

That’s about it. We think that the site is useful, the contribution target is modest and the benefits are substantial. We hope you agree and agree chip in. Too, clicking on and bookmarking our Amazon link helps us a lot, costs you nothing and minimizes your time at the mall.

Now, back to our story!

Charge of the Short-Pants Brigade

“What is youth except a man or a woman before it is ready or fit to be seen.”

Evelyn Waugh

edward, ex cathedraWe are now in that time of the year, December, which I will categorize as the silly season for investors, both institutional and individual. Generally things should be settling down into the holiday whirl of Christmas parties and distribution of bonus checks, at least in the world of money management. Unfortunately, things have not gone according to plan. Once again that pesky passive index, the S&P 500, is outperforming many active managers. And in some instances, it is not just outperforming, but in positive total-return territory while many active managers are in negative territory. So for the month of December, there is an unusual degree of pressure to catch-up the underperformance by year-end.

We have seen this play out in the commodities, especially the energy sector. As the price of oil has drifted downwards, bouncing but now hovering around $40 a barrel, it has been dangerous to assume that all energy stocks were alike, that leverage did not matter, and that lifting costs and the ability to get product to market did not matter. It did, which is why we see some companies on the verge of being acquired at a very low price relative to barrels of energy in the ground and others faced with potential bankruptcy. It did matter whether your reserves were shale, tar sands, deep water, or something else.

Some of you wonder why, with a career of approaching thirty years as an active value investor, I am so apparently negative on active management. I’m not – I still firmly believe that over time, value outperforms, and active management should add positive alpha. But as I have also said in past commentaries, we are in the midst of a generational shift of analysts and money managers. And it is often a shift where there is not a mentoring overlap or transition (hard to have an overlap when someone is spending much of his or her time a thousand miles away). Most of them have never seen, let alone been through, a protracted bear market. So I don’t really know how they will react. Will they panic or will they freeze? It is very hard to predict, especially from the outside looking in. But in a world of email, social media, and other forms of instantaneous communication, it is also very hard to shut out the outside noise and intrusions. I have talked to and seen managers and analysts who retreated into their offices, shut the door, and melted under the pressure.

For many of you, I think the safer and better course of action is to allocate certain assets, particularly retirement, to passively-managed products which will track the long-term returns of the asset classes in which they are invested. They too will have maximum draw-down and other bear market issues, but you will eliminate a human element that may negatively impact you at the wrong time.

The other issue of course is benchmarking and time horizons, which is difficult for non-value investors to appreciate. Value can be out of favor for a long, long period of time. Indeed it can be out of favor so long that you throw in the towel. And then, you wish you had not. The tendency towards short-termism in money management is the enemy of value investing. And many in money management who call themselves value managers view the financial consultant or intermediary as the client rather than Mr. and Mrs. Six-Pack whose money it is in the fund. They play the game of relative value, by using strategies such as regression to the mean. “See, we really are value investors. We lost less money than the other guys.”

The Real Thing

One of the high points for me over the last month was the opportunity to attend a dinner hosted by David Marcus, of Evermore Global Value, in Boston, at the time of the Schwab Conference. I would like to say that David Snowball and I attended the Schwab Conference, but Schwab does not consider MFO to be a real financial publication. They did not consider David Snowball to be a financial journalist.

I have known of David Marcus for some years, as one of the original apostles under Max Heine and Michael Price at Mutual Shares. I am unfortunately old enough to remember that the old Mutual Shares organization was something special, perhaps akin to the Brooklyn Dodgers team of 1955 that beat the Yankees in the World Series (yes, children, the Dodgers were once in Brooklyn). Mutual Shares nurtured a lot of value investing talent, many of whom you know and others, like Seth Klarman of Baupost and my friend Bruce Crystal, whom you may not.

David Snowball and I subsequently interviewed David Marcus for a profile of his fund. I remember being struck by his advice to managers thinking of starting another 1940 Act mutual fund – “Don’t start another large cap value fund just like every other large cap value fund.” And Evermore Global is not like any other fund out there that I can see. How do I know? Well, I have now listened to David Marcus at length in person, explaining what he and his analysts do in his special situation fund. And I have done what I always do to see whether what I am hearing is a marketing spiel or not. I have looked at the portfolio. And it is unlike any other fund out there that I can see in terms of holdings. Its composition tells me that they are doing what they say they are doing. And, David can articulate clearly, at length, about why he owns each holding.

What makes me comfortable? Because I don’t think David is going to morph into something different than what he is and has been. Apparently Michael Price, not known for suffering fools gladly, said that if the rationale for making an investment changed or was not what you thought it was, get rid of the investment. Don’t try and come up with a new rationale. I will not ruin your day by telling you that in many firms today the analysts and portfolio managers regularly reinvent a new rational, especially when compensation is tied to invested assets under management. I also believe Marcus when he says the number of stocks will stay at a certain level, to make sure they are the best ideas. You will not have to look back at prior semi-annual reports to wonder why the relatively concentrated fund of forty stocks became the concentrated fund of eighty stocks (well it’s active share because there are not as many as Fidelity has in their similar fund). So, I think this is a fund worth looking at, for those who have long time horizons. By way of disclosure, I am an investor in the fund.

Final Thoughts

For those of you who like history, and who want to understand what I am talking about in terms of the need for appreciating generational shifts in management when they happen, I commend to you Rick Atkinson’s first book in his WWII trilogy, An Army at Dawn.

My friend Robin Angus, at the very long-term driven UK Investment Trust Personal Assets, in his November 2015 Quarterly Report quoted Brian Spector of Baupost Partners in Boston, whose words I think are worth quoting again. “One of the most common misconceptions regarding Baupost is that most outsiders think we have generated good risk-adjusted returns despite holding cash. Most insiders, on the other hand, believe we have generated those returns BECAUSE of that cash. Without that cash, it would be impossible to deploy capital when … great opportunities became widespread.”

Finally, to put you in the holiday mood, another friend, Larry Jeddeloh of The Institutional Strategist, recently came back from a European trip visiting clients there. A client in Geneva said to Larry, “If you forget for a moment analysis, logic, reasoning and just sniff the air, one smells gunpowder.”

Not my hope for the New Year, but ….

Edward A. Studzinski

When Good Managers Go Bad

Slogo 2By Leigh Walzer, founder and principal of Trapezoid, LLC. Leigh’s had a distinguished career working in investment management, in part in the tricky field of distressed securities analysis. He plied that trade for seven years with Michael Price and the Mutual Series folks. He followed that with a long stint as a director at Angelo, Gordon & Co., a well-respected alternatives manager and a couple private partnerships. Through it all, Leigh has been insatiably curious about not just “what works?” but, more importantly, “why does it work?” That’s the work now of Trapezoid LLC.


Continuing the theme of learning from failure… One of the toughest decisions for investors is what to do when a portfolio manager who had been performing well turns in a bad year? We can draw on our extensive database of manager skill for insight and precedents.

The Trapezoid system parses out manager skill over time. Our firm strives to understand whether past success was the result of luck or skill and determine which managers are likely to earn their fees going forward. Readers can demo the system for free at www.fundattribution.com where most of the active US equity mutual funds are modelled. The demo presents free access to certain categories with limited functionality.

To answer the question we look back in time for portfolio managers who experienced what we call a “Stumble.” Specifically, we looked for instances where a manager who had negative skill over the latest twelve months and positive skill in the preceding three years. The skill differential had to be at least 5 points. Skill in this case is a combination of Security Selection and Sector Selection. We evaluated data over the past 20 years, ignoring funds with a manager change or insufficient history.

Our goal was to see how these managers did following the Stumble. To make the comparison as fair and unbiased as possible, we compared the Stumble managers to a control group who had the same historical skill with no Stumble.

Exhibit I illustrates with two hypothetical funds. Coyote Fund had the same cumulative skill over a four year period – but investors in Roadrunner followed a much rougher path, and saw their value plummet in Year 4.

EXHIBIT I

Returns from Two Hypothetical Funds

  Year 1 Year 2 Year 3 Year 4
Roadrunner 5 3 4 -8
Coyote -3 1 5 0.5

Should holders of Roadrunner switch? Does the most recent performance suggest Roadrunner might have lost its Mojo? Does Roadrunner deserve a mulligan for an uncharacteristic year? Or should investors stick to their conviction that over the long haul Roadrunner and Coyote are equally skilled and stay the course? Or that Roadrunner is due for a bounce back?

Managers who stumble take approximately 30 months to regain their footing

Our database indicates that managers who stumble take approximately 30 months to regain their footing. During that thirty month period, these funds underperform by an incremental 3%. (See Exhibit II) This suggests investors would do well to switch from Roadrunner to Coyote. Note that a lot of the performance disparity occurs in the first few months after a Stumble, so close monitoring might allow investors to contain the damage. But if you don’t react quickly, there is a stronger case to stay put.

Why are managers slow to recover after a stumble? For many funds skill is partly cyclical. Cyclicality can occur because funds participate in market themes and seams of opportunity which play out over time. Strong or poor performance may affect funds flow which may further impact returns. So a Stumble may not tell investors much about the long term prognosis, but it is helpful in predicting over the short term. Our algorithms try to distinguish secular from cyclical trends and, equally important, how confident we can be in making predictions.

EXHIBIT II

Typical Skill Trend after Stumble Event

On a related note, we are sometimes asked whether managers learn from their experience and become better over time. We are sympathetic to the view that managers with a few gray hairs might do better than their younger peers, but the data doesn’t support this. In general managers with more experience don’t outperform the greenhorns, but they don’t seem to lose their fastball either.

skill development

But there is something interesting in this chart. Managers who survive a crisis do a little better than their peers in later years. One explanation is that with the battle scars come some valuable lessons which helps managers navigate the market better.

We looked for specific funds which stumbled recently. They are listed in Exhibit III. Some of these funds actually have good 3-5 year track records and have fund classes on the Trapezoid Honor Roll, which is separate from the Observer’s. Think of the Stumble Event as an early warning indicator: we are looking for funds that have lost altitude or veered off their trajectory.

EXHIBIT III

Funds with Stumble Event in the 12 Months Ending June 2015

  AUM $bn Category Stumble Magnitude
ClearBridge Aggressive Growth Fund 13.2 Large Opport. -5%
MFS Growth Fund 11.1 All-Cap Growth -6%
Federated Strategic Value Dividend Fund 9.2 Large Value -6%
Putnam Capital Spectrum Fund 9.2 Dynamic Alloc. -7%
American Century Ultra Fund 7.9 Large Blend -5%
Artisan Mid-Cap Value Fund 7.2 Mid-Cap Blend -6%
Baron Growth Fund 7.0 Small Blend -8%
Columbia Acorn International Fund 6.9 Foreign SMID Growth -9%
BBH Core Select Fund 4.9 Large Blend -6%
Fairholme Fund 4.9 Large Value -19%
Touchstone Sands Capital Select Growth Fund 4.9 Large Growth -9%
MFS International New Discovery Fund 4.8 Foreign All-Cap Growth -9%
Fidelity Fund 4.7 Large Blend -5%
Baron Small-Cap Fund 4.5 Small Growth -7%
Invesco Charter Fund 4.4 Large Blend -12%

We took a harder look at the largest fund on the list, ClearBridge Aggressive Growth (SAGYX).

EXHIBIT IV

ClearBridge Aggressive Growth Fund: Recent Performance

sagbx

This $14bn fund has a 32 year history with the same lead manager in place throughout. At various times in the past it was known as Shearson, Smith Barney, or Legg Mason Aggressive Growth Fund.

We don’t have data back to inception, but over the past 20 years, the manager (Richard Freeman) has demonstrated sector selection skill of approximately 1% per year. Exhibit IV shows the recent net returns (courtesy of Morningstar). We see little or no stock picking skill. The fund is very concentrated and differentiated; the Active Index (or OAI) is 23; in general when we see scores over 18, we read it as evidence of a truly active manager). Over the past 5 years, sector selection has contributed approximately 3%/year. Based on this showing, our Orthogonal Attribution Engine (or OAE, the tool we use to parse out the effects of each of the six sources of a fund’s over- or under-performance) has enough confidence to incur expenses of roughly 1%/year. As a result, several fund classes are on our Trapezoid Honor Roll – i.e., we have 60% confidence skill justifies expenses. The fund has tripled in size in three years which is a bit of a concern. We can replicate the fund with 87% R-squared. Our “secret sauce” to replicate the fund is a blend of S&P500, small-cap, a very large dollop of biotech, and small twists of media, energy, and healthcare. The recipe doesn’t seem to have changed much over time.

Exhibit V gives a sense of the cyclicality of combined skill over time, the manager has had some periods of exceptional performance but also some slumps. The first half of 2002 was a rough period for the fund; the negative skill reflects mainly that the fund had (as always) a heavy overweight on biotech which badly underperformed the market during that timeframe.

EXHIBIT V

ClearBridge Aggressive Growth: Combined Skill from Security Selection and Sector Rotation (1995-2015)

clearbridge chart

Coming into the second half of 2014, the fund had its characteristic strong overweight on biotech. This weighting should have served the fund well. However, security selection was negative in the twelve months ended July 2014. (NB: The fund’s Fiscal Year ends August) Some of the stocks the fund had held for several years and ridden up like Biogen, SanDisk, Cree, and Weatherford did not work in this environment. We view this as negative skill, since the manager could have sold high and redeployed to other stocks in the same sector. Our math suggests the fund also incurred above average trading costs over the past year, which shows up in our model as negative skill. We asked ClearBridge to review our findings but they did not respond as of this writing.

ClearBridge Aggressive Growth re-entered Stumble territory in June. We noted earlier that funds with a Stumble event tend to lose another 2.5% before regaining their footing. In their case, that prediction has held true. We have not refreshed their skill but they have lagged the S&P500 badly. Most recently, another big biotech position they rode up, Valeant Pharmaceuticals, has come undone.

Bottom Line: Investors should consider heading to the sidelines when a fund stumbles and wait until the dust clears. We usually pay more heed to long term track record than short term blips and momentum. But a sudden drop-off in skill usually portends more pain to come. So for marginally attractive funds a Stumble Event may be a sell signal.

ClearBridge has had the conviction to remain overweight biotech for many years which has served them well. That sector now has negative momentum. We expect the poor security selection will even out over time. Investors who are neutral or positive on the sector should give the fund the benefit of the doubt.

To see additional details, please register at www.fundattribution.com and click on the Stumbles link from the Dashboard. As always, we welcome your comments at lwalzer@fundattribution.com

Quick hits: Resilient small caps and tech funds

Partly as a teaching tool, I’ve been walking folks through how to use our fund screener. Two outputs that you might find interesting:

Resilient small cap winners: which small cap funds came closest to letting you have your cake and eat it, too? That is, which were cautious enough to post both relatively limited losses in the 2007-09 bear market and to manage top tier returns across the entire market cycle (2007 – present)? Three stand out:

Intrepid Endurance (ICMAX), a cash-heavy absolute value fund once skippered by Eric Cinnamond, now of Aston River Road Independent Value (ARIVX).

Dreyfus Opportunistic Small Cap (DSCVX), a much more volatile fund whose upside has outpaced its downside. It’s closed to new investors.

Diamond Hill Small Cap (DHSCX), a star that’s set to close to new investors at the end of December.

Resilient tech: did any tech funds manage both of the past two bears, 2000-02 and 2007-09? I screened for the funds that had the lowest maximum drawdowns and Ulcer Indexes in both crashes. Turns out that risk-sensitivity persisted: four of the five most stable funds in 2002 were on the list again in 2007. The best prospect is Zachary Shafran’s Ivy Science & Tech (WSTAX). It’s more of a “great companies that use tech brilliantly” firm than a pure tech play. Paul Wick’s Columbia Seligman Communication & Information (SLMCX) was almost as good but there’s been a fair turnover in the management team lately. Two Fidelity Select sector funds, IT Services (FBSOX) and the soon-to-be-renamed Software & Computer Services (FSCSX), also repeated despite 17 manager changes between them. Chip, our IT services guru, mumbles “told you so.”

charles balconyCategory Averages

As promised, we’ve added a Category Averages tool on the MFO Premium page. Averages are presented for 144 categories across 10 time frames, including the five full market cycles period dating back to 1968. The display metrics include averages for Total Return, Annualized Percent Return (APR), Maximum Drawdown (MAXDD), MAXDD Recovery Time, Standard Deviation (STDEV, aka volatility), and MFO Risk Group ranking.

Which equity category has delivered the most consistently good return during the past three full market cycles? Consumer Goods. Nominally 10% per year. It’s also done so with considerably less volatility and drawdown than most equity categories.

averages1
One of the lower risk established funds in this category is Vanguard Consumer Staples Index ETF VDC. (It is also available in Admiral Shares VCSAX.) Here are its risk and return metrics for various time frames:

averages2
The new tool also enables you to examine Number of Funds used to compute the averages, as well as Fund-To-Fund Variation in APR within each category.

Morningstar anoints the “emerging, unknown, and up-and-coming”

In mid-November, Dan Culloton shared the roster of Morningstar Prospects with readers. These are funds that “emerging, unknown and up-and-coming.” They’re listed below, while the link above will take you to the Morningstar video center where a commercial and a video interview will auto-launch.

One measure of the difference between Morningstar’s universe and ours: they can see 23 year old funds as “emerging” and $10 billion ones as “unknown.” We don’t.

  AUM Inception  
BBH Global Core Select BBGRX 138 million 3/2013 Limited overlap with the management team for BBH Core Select. So far a tepid performer. It has a bit lower returns than its Lipper peers and a bit lower volatility. In the end, the lifetime Sharpe ratio is identical.
Bridge Builder Core Bond BBTBX 10.0 billion 10/2013 Splendid fund except “Fund shares are currently available exclusively to investors participating in Advisory Solutions, an investment advisory program or asset-based fee program sponsored by Edward Jones.” Charles is not a fan of EJ’s fees.
Fidelity Conservative Income FCONX 3.7 billion 03/2011 A very low volatility ultra-short bond fund. It gives up about 100 bps a year in returns to its peers. Still its volatility is so low that its measures of risk-adjusted returns (Sharpe, Martin and Sortino ratios) shine.
JOHCM International Select II JOHAX 3.1 billion 7/2009 Great fund. Returns about twice its peer average with no greater volatility. We profiled it shortly before it closed to new investors to give folks a think about whether they wanted to get in.
Polen Growth POLRX 732 million 12/2010 A low turnover, large-growth fund that, in the long term, has beaten its peers by about 2% a year with noticeably lower volatility. Just passed the five-year mark with the same managers since inception.
Smead Value SMVLX 1.3 billion 1/2008 One major change since we profiled Smead two years ago: Cole, the manager’s son, has been added as co-manager and seems more and more to be driving the train. So far, the fund’s splendid record has continued.
SSgA Dynamic Small Cap SVSCX 77 million 7/1992 This is the most intriguing one of the bunch. Risk-sensitive small cap quant fund. New manager in 2010 and co-manager in 2015. Top 1% performer over those five years. Lewis Braham mentioned it as one of “five great overlooked little funds” in October. One flag: assets have tripled in the past three months.

Farewell to FundFox

We’re saddened to report the closure of FundFox, the only service devoted exclusively to target federal litigation involving the fund industry. It was started in 2012 by David Smith, who used to work for the largest liability insurance provider to the fund industry, as a simpler, cleaner, more specialized alternative to services such as WestLaw or Lexis. David drew an exceedingly loyal (think: 100% resubscription rate) readership that never grew enough for the service to become financially self-sustaining. David closed on Friday the 13th of last month. David’s monthly column has run in the Observer for the past 17 months. We’ll miss him.

David’s going to take a deep breath now, enjoy the holidays and think about his next steps. One possibility would be to work in a fund compliance group; another would be to join his family’s century-old citrus business.

“Two roads diverged in a yellow wood, And sorry I could not travel both.” Diverged indeed.

Cap gains 2015: Not as bad as last year, except for those that are much worse

CapGainsValet.comcapgainsvalet is up and running again (and still free). CGV is designed to be the place for you to easily find mutual fund capital gains distribution information. If this concept is new to you, have a look at the Articles section of the CGV website where you’ll find educational pieces ranging from beginner concepts to more advanced tax saving strategies.

I’ve been gathering and posting 2015 capital gain distribution estimates for CapGainsValet.com for the last two months. My database currently has distribution estimates for almost 190 fund firms. This represents 90% of the firms I’m hoping to eventually add, which means the 2015 database is nearly complete. (Hurray for me!)

I recently had a look through last year’s database to see how it compares to this year’s numbers. Here’s what I found:

  • Fewer funds are distributing more than 10%. Last year I found 517 mutual funds that distributed more than 10% of their NAV. From all indications, 2014 was one of the biggest distribution years on record. For 2015, I’ve found 367 funds that are going to distribute more than 10%. My guess is that we’ll end the year in the 375-380 range.
  • More BIG distributions. In 2014, I was able to find 12 funds that distributed more than 30% of their NAV. This year that number has already jumped to 19. Even though the number of 30% distributors has increased, the number of funds that are distributing between 20% and 30% of NAV is about half of what it was last season.
  • Several big names in the doghouse. If you take a look at my “In the Doghouse” list, you will find that there are some of the bigger names in the actively managed funds universe. Montag & Caldwell Growth, Columbia Acorn and Fairholme will be distributing billions. Successful funds with large fund outflows are likely going to have trouble controlling future capital gains distributions.
  • ETFs are still looking very tax efficient. Although CGV does not track ETF distributions, I am seeing very low capital gain numbers from ETF providers. Market-cap weighted index funds and ETFs continue to be tax efficient.
  • More tax swapping opportunities. Last year’s distributions corresponded to a fairly solid year of gains – it is not looking like that will be the case this year. Last year, selling a fund the tarbox groupbefore its large capital gain distribution meant little difference because the fund’s embedded gains were similar or larger. If you bought a fund this year, receiving a large distribution will likely result in a higher tax bill than if you sell the fund before its record date. At Tarbox (my day job) we have already executed a number of tax-swap trades that will save our clients hundreds to thousands of dollars on their 2015 tax return. Have a look through your holdings for these types of opportunities.

Of course, CGV is not the only site providing shortcuts to capital gain distribution estimates. MFO’s discussion board has an excellent list of capital gain distribution estimates with a number of fund firms too small for the CGV database. Check it out and provide some assistance if you can.

Mark Wilson, APA, CFP®
Chief Investment Officer, The Tarbox Group, Inc.
Chief Valet, CapGainsValet

The Alt Perspective: Commentary and news from DailyAlts.

Give Up The Funk

Every once in a while an asset category gets into a funk. Value investing was in a funk leading up to the dotcom bubble, growth stocks were in a funk following the dotcom bubble, etc. You probably know what I mean. Interestingly, active management is in a funk right now – just take a look at the below chart from Morningstar’s most recent U.S. Asset Flows report (includes both mutual funds and ETFs):

net flows

Actively managed funds have lost $136 billion in assets over the past year! Are investors taking their dollars out of funds? No. Passive funds have pulled in $457 billion over that same time period. That’s a gap of nearly $600 billion! On a net basis, investors have poured $320 billion of new dollars into mutual funds and ETFs in the past 12 months, nearly $27 billion per month on average. That’s some serious coin.

Is Active Management Dead?

So what is the story, is active management dead? No, active management is not dead, and it never will be. Part of the problem is that most actively managed funds are mutual funds, while most passive funds are ETFs. ETFs have a lower cost structure and a lower barrier to entry. Advantage passive ETFs. This will shift over time with new product development, and the pendulum will swing back, at least part way. Other factors are also at play, and just like other funks, things will change.

But in the meantime, one of the four categories of actively managed funds to garner assets over the past year, and only one of two in October, was that of Alternatives. Why? Because alternative funds offer diversification beyond traditional stock and bond portfolios. They offer investors exposure to more unconstrained forms of investing that can generate lower risk and/or provide improved portfolio diversification due to their low correlation with long-only stocks and bonds.

A recent paper by the Alternative Investment Management Association (AIMA) and the Chartered Alternative Investment Analyst Association (CAIA Association) appropriately breaks hedge funds down into two categories: Substitutes and Diversifiers. This is an important distinction since each grouping has a different role in a portfolio, and can have a different impact on overall results. Substituted replace assets that are already existing in most portfolios, such as stocks and bonds, while diversifiers are investment strategies that have a low to zero correlation with traditional asset classes. If you are considering, or even currently using alternatives, I would encourage you to read the paper.

Liquid Alts Asset Flows

So let’s take a quick look at the asset flows into, or out of, liquid alternatives for October. The picture hasn’t changed much in the past few months. Flows are going into multi-alternative funds, managed futures funds and volatility funds, while assets are flowing out of non-traditional bonds funds and bit out of other categories.

asset flows

Leading up to 2015, non-traditional bond fund had significant inflows as everyone expected rates to rise. Many of these funds are designed to protect against rising rates. Here we are in late November 2015 and still no rate rise. Mediocre performance and not significant rate rise in sight, and out go investors who need income and returns more than protection.

Quick Wrap

A couple final notes of interest from the news and research categories this past month:

Be sure to check out DailyAlts.com for more updates on the liquid alternatives market, and feel free to sign up for our free daily or weekly newsletter.

Observer Fund Profiles: Fidelity Total Emerging Markets

Each month the Observer provides in-depth profiles of between two and four funds.  Our “Most Intriguing New Funds” are funds launched within the past couple years that most frequently feature experienced managers leading innovative newer funds.  “Stars in the Shadows” are older funds that have attracted far less attention than they deserve. 

Fidelity Total Emerging Markets (FTEMX): we’ve long argued that EM investors need to find a strategy for managing volatility and that a balanced fund is the best strategy they’ve got. There’s a good argument that John Carlson’s fund is the best option for pursuing that best strategy.

Elevator Talk: Bryn Torkelson, Matisse Discounted Closed-End Fund Strategy (MDCAX/MDCEX)

elevatorSince the number of funds we can cover in-depth is smaller than the number of funds worthy of in-depth coverage, we have decided to offer one or two managers each month the opportunity to make a 200 word pitch to you. That’s about the number of words a slightly-manic elevator companion could share in a minute and a half. In each case, I’ve promised to offer a quick capsule of the fund and a link back to the fund’s site. Other than that, they’ve got 200 words and precisely as much of your time and attention as you’re willing to share. These aren’t endorsements; they’re opportunities to learn more.

bryn torkelson

Bryn Torkelson

Bryn Torkelson manages MDCAX, which launched at the end of October 2012. He also co-founded and owns the advisor (launched in 2010) and the sub-adviser, Deschutes Portfolio Strategies (launched in 1997). Bryn started in the investment industry in 1981 as a broker with Smith Barney and later worked with Dain Bosworth. He has a B.S. in Finance from the University of Oregon, which is helpful since some of the research underlying the strategy was conducted at the university’s Lundquist College of Business. He manages one hedge fund, Matisse Absolute Return Fund, a 5 star rated fund by Morningstar, and about 700 separate accounts, mostly for high net-worth individuals. In all, the firm manages about $900 million.

He’s headquartered in Lake Oswego, Oregon, a curiously hot spot for investment firms. It’s also home for the advisers of the Jensen and Auxier funds.

The story here’s pretty simple. Taken as a group, closed-end fund (CEF) portfolios return about what the overall market does. So if you simply invested in all the existing CEFs, you’d own an expensive index fund. CEFs, much more than other investment vehicles, are owned mostly by individual investors. Those folks are given to panic and regularly offer to sell $100 in stocks for $80; on a really bad day, they’ll trade $100 in stocks for $60 in cash. That’s irrational. Buyers move in, snap up assets at lunatic discounts and the discounts largely evaporate.

Here’s the Matisse plan: research and construct a portfolio from the 20% most discounted funds in the overall universe of income-producing CEFs, wait for the discounts to evaporate, then rebalance typically monthly to restock the portfolio with the most-discounted quintile. Research from the Securities Analysis Center at Oregon, looking back as far as they could get monthly price and discount data (1988), suggests that strategy produced 20% a year with a beta of .75. In their separate accounts which started in 2006, the strategy has produced approximately 9% net annually mostly from income and 2-3% capital gains from the contraction of the CEF discounts. Those gains are useful because they’re market neutral; that is, the discounts tend to contract over time whether the overall market is rising or falling.

Sadly, in the three years since launch, the mutual fund has returned just 3.3% a year (through late November 2015) which is better than the average tactical allocation fund but far lower than a generic balanced fund. Mr. Torkelson argues that CEF discounts reached, and have stayed at near-record levels this year which accounts for the modest gains. The folks at RiverNorth, who use a different CEF arbitrage strategy in RiverNorth Core Opportunities (RNCOX), agree with that observation. Despite “tough sledding,” Mr. T. believes the CEF market likely bottomed-out in October, which leaves him “very optimistic going forward.” He notes that, since 1988, discounts have only been wider 3% of the time – during a few months in 2008-2009, the tech bubble in 2000 and during the recession of 1990. Today his portfolios have an average discount of 17.5% and a distribution yield of 8.2%.

Here are Mr. Torkelson’s 281 words on why you should add MDCAX to your due-diligence list:

I started our fund/strategy to help investors gain access to higher income opportunities than available in ETF’s or open ended mutual funds. Today the funds distribution income is approximately 8.2%. The misunderstood market of “closed end mutual funds” (CEF’s) presents investors opportunities to buy quality income funds at 15-20% discounts to published market values. When we buy discounts our clients’ portfolios will generates substantially higher income than similar ETF’s or open ended mutual funds.

The entire CEF universe is approximately 500+ funds representing $230 billion in assets. Most of these funds are designed to pay income, often distributed monthly or quarterly. The source of the income varies on each funds objective. However, income is generated from taxable or municipal bonds, preferred stock, convertible bonds, bank loans, MLP’s, REIT’s, return of capital (ROC) or even income from “covered call writing” strategies on the portfolio.

The exciting aspect of the strategy is these CEFs trade on stock exchanges and they often trade at market values well below their published daily Net Asset Values (NAV). Our studies indicate there is a high probability for the discounts to be “mean reverting”. When this happens our clients receive both capital gains in addition to income. For example, firms like Blackrock or PIMCO manage both open ended mutual funds and closed end funds often with the same manager and or objectives. If you purchase the highly discounted vehicle of CEF’s instead of the opened ended equivalent vehicle, you’ll typically get much better returns. The other great part of our strategy is our investors get a highly diversified portfolio without any concentration worries. On a look-through basis our investors get a highly discounted income oriented global balanced portfolio.

Matisse Discounted Closed-End Fund Strategy has a $1000 minimum initial investment on its “A” shares, which bear a sales load, and $25,000 on its Institutional shares, which do not. Matisse has limited the funds expense ratio to 1.25% on the “I” shares. The pass-through costs of CEF funds in which they invest are included and a central and unavoidable contributor to the overall fees. Those pass-throughs accounted for 1.37% last year. With those fees included the expenses on the “I” shares run a stiff 2.62% while the “A” shares are 25 basis points higher. The fund has gathered about $120 million in assets since its October 2012 launch. They have $200 million the overall strategy. It just earned its initial Morningstar rating of three stars within the “tactical allocation” universe for the “I” shares and two stars for the “A” shares for investors who pay the full load.

You’ve got a sort of embarrassment of riches as far as web contacts go. In addition to the sub-adviser’s site, there are separate sites for the Matisse strategy and for the Matisse mutual fund. The former is a bit more informative about what they’re up to; the latter is better for details on the fund. Bryn’s strategy predates his mutual fund. The first six slides on this presentation gives a view of the strategy’s longer-term performance.

Launch Alert: DoubleLine Global Bond Funds

For those who can’t get enough of bondfant terrible Jeffrey Gundlach, DoubleLine Global Bond Fund (DLGBX) is arriving just in time. The fund launched on November 30, 2015 with Mr. Gundlach at the helm. This will be the 17th fund on Mr. Gundlach’s daily to-do list which also includes nine funds on which DoubleLine is a sub-adviser and seven in-house ones. On whole he’s responsible for 50 accounts and about $70 billion in assets.

The fund’s investment objective is to seek long-term total return. The plan is to invest, mostly, in investment-grade debt issued, mostly, by G-20 countries. Once we’re past the “mostly,” things open up to include high-yield debt, swaptions, shorting, currency hedges, bank loans, corporate bonds and other creatures. They expect an average duration of 1-10 years.

In case you’re wondering if there are any particular risks to be aware of, DoubleLine offers this list:

risks

The minimum initial investment for the retail shares is $2000 and the opening expense ratio is 0.96%.

Folks on our discussion board would urge you to consider T. Rowe Price Global Multi-Sector Bond (PRSNX) and PIMCO Total Return Active ETF (BOND) as worthy, tested, less-expensive alternatives.

Funds in Registration

We’ve reached the slow time of the year. Funds in registration now won’t be able to claim full-year returns for 2016, so there tends to be a lull in new fund releases. This month we found just five retail, no-load funds in SEC registration. Two are hedge funds undergoing conversion (LDR Preferred Income and Livian Equity Opportunity), two are edgy internationals (Frontier Silk Invest New Horizons and Harbor International Small Cap, managed by Barings) and one an ESG-oriented blue chip fund, TCW New America Premier Equities. All are them are here

Manager Changes

Chip tracked down 69 full or partial management changes this month, substantial but not a record. The retirement of Jason Cross, one of the founding managers and lead on their long/short trading strategy, from the Whitebox Funds is pretty consequential. Clifton Hoover is stepping away from Dreman Contrarian SCV (DRSAX) to become Dreman’s CIO. Otherwise, it’s mostly not front-page news.

Rekenthaler: “Great” funds aren’t worth the price of admission

John Rekenthaler, a guy who regularly thinks interesting thoughts, collaborated with colleague Jeff Ptak to test the truism that the best long-term strategy is to invest in “singles hitters.” That is, to invest in funds that are consistently a bit above average rather than alternately brilliant and disastrous. By at least one measure, that’s an … um, untruism. Rekenthaler and Ptak concluded that the funds with the best long-term records are ones that frequently land in their peer group’s top tier. They were home run hitters; singles hitters fell well behind.

Sadly, they also concluded that such funds (think Fairholme FAIRX or CGM Focus CGMFX) are often impossible to own. Mr. Ptak writes:

Great funds probably aren’t good. Rather, they’re intermittently amazing and horrendous. Streaky. Hard to stick with. Demanding. That would seem to match findings that the long-term standouts have often plumbed their category’s depths, owning securities that others neglect. Bad stuff routinely happens to great funds. Being merely good isn’t enough. You have to be bad … awful at times … and stick with it … and then maybe you’ll be great.

It’s an interesting, though incomplete, argument. We should think about it.

Updates: Gross, Black, Sequoia

In July 2014, after listening to Bill Gross’s disjointed maundering as a Morningstar keynote speaker, we suggested that he’d lost his marbles and that it was time either for him to go or for you to. In September 2014 he stomped off. In October 2015 he decided to sue PIMCO for succumbing to “a lust for power” in their efforts to oust him. A quarter billion or so would make him feel better. Now PIMCO has filed a motion to dismiss the suit, claiming that

The complaint, parts of which read more like a screenplay than a court pleading, uses irrelevant and false personal attacks on Mr. Gross’s former colleagues in an apparent effort to distract attention from the fundamental failings of these ‘contract’ claims.

They’ve urged him to get on with his life. Stay tuned, since I don’t see that happening. 

We reported in October, in an admirably dispassionate voice, on the sudden departure of Gary Black from Calamos Investments. In September, Calamos noted that Mr. Black was gone from the firm “effective immediately.” The company positioned it as “an evolution of the management.” He left after three years, a Calamos rep explained, because he “completed the work he was hired to do.” They had no idea of what he was going to be doing next.

Randy Diamond, writing for Pensions & Investments (11/30/2015) hints at a rather more colorful tale in his essay “Calamos continues fighting after another change at the top.”

Mr. Black lasted a little more than three years at Calamos. He joined the firm in August 2012 to replace Mr. Calamos’ nephew, Nick Calamos. Although a news release at the time said Nick Calamos “decided to step back from the day-to-day business of the firm to pursue personal interests,” sources interviewed said he left after frequent clashes with his uncle over how to fix poor investment performance in the firm’s strategies.

Sources said one reason Mr. Black left involved the team from his New York-based long-short investment business, which he sold to Calamos Investments when he joined the firm. Sources said five of the team’s seven investment professionals left this year in a dispute with John Calamos over compensation.

After the dissolution of Mr. Black’s long-short unit, the firm acquired a new long-short team, Phineus Partners LP of San Francisco.

In November 2015, we argued that the Sequoia Fund “seems in the midst of the worst screw-up in its history.” The fund, against the warnings of its board, sunk a third of its portfolio in Valeant Pharmaceuticals (VRX). The managers’ defense of Valeant’s business practices sound a lot like they were written by Valeant or by folks pressured into being cheerleaders. James Stewart, writing in the New York Times, did a really nice follow-up piece, “Huge Valeant Stake Exposes Rift at Sequoia Fund” (11/12/2015). In addition to dripping acid on Sequoia’s desperate argument that betting the farm on Valeant CEO Michael Pearson was no different than when they bet the farm on Berkshire-Hathaway CEO Warren Buffett, Stewart also managed to get some information on the arguments made by the two board members who resigned. It’s very much worth reading.

The fund lost another 1.26% in November, which places it in the bottom 1% of its peer group. Valeant dropped 22% in the same period which suggests its impact on the portfolio is dwindling. Over the past three years, it trails 98% of its peers. (Leigh Walzer might say this qualifies as “a stumble.”)

After talking with Sequoia management (“they were very cooperative”) but not with the trustees who resigned in protest, Morningstar reaffirmed Sequoia’s Gold rating.

Several of us have taken the position that we’re likely in the early stages of a bear market. The Wall Street Journal (12/01/2015) reports two troubling bits of economic data that might feed that concern: US corporate capital expenditures (capex) continue dropping and emerging market corporate debt defaults continue rising. For the first time in recent years, e.m. default rates exceed U.S. rates.

Briefly Noted . . .

One of the odder SEC filings this month: “Effective November 30, 2015, the Adaptive Allocation Fund (AAXAX) will no longer operate a website, and any references within the Prospectus and SAI to www.unusualfund.com are hereby deleted.” No idea.

BofA Global Capital Management is selling their cash asset management business to BlackRock, sometime in the first half of 2016.

Templeton Foreign Smaller Companies Fund (FINEX), Templeton Global Balanced Fund (TAGBX) and Templeton Global Opportunities Trust (TEGOX) have each added the ability to “sell (write) exchange traded and over-the-counter equity put and call options on individual securities held in its portfolio in an amount up to 10% of its net assets to generate additional income for the Fund.”

SMALL WINS FOR INVESTORS

The Fairholme Allocation Fund (FAAFX) reopened to new investors on November 18. The fund has had one great year (2013) since inception and has trailed 97% over the past three years. Assets have dropped from $379 million at the end of November 2014 to $298 million a year later.

JPMorgan Small Cap Equity Fund (VSEAX) reopened to new investors on November 16, 2015. It’s an exceptionally solid fund with a large asset base; I assume the reopening came because inflows stabilized rather than in response to outflows.

Effective January 1, 2016, Royce is dropping the management fee on Royce European Small-Cap Fund (RISCX), Global Value Fund (RIVFX), International Small-Cap Fund (RYGSX), and International Premier Fund (RYIPX) by 25 bps.

Effective November 17, 2015, the management fees of Schwab U.S. Broad Market, U.S. Large-Cap, U.S. Large-Cap Growth, and U.S. Large-Cap Value ETFs have been reduced by one basis point each. The resulting expense ratios range from 3-6 bps.

CLOSINGS (and related inconveniences)

Effective January 29, 2016, the AQR Style Premia Alternative Fund (QSPNX) and AQR Style Premia Alternative LV Fund (QSLNX) will be closed to new investors. They’re two year old institutional funds. Both have posted exceedingly strong returns with the Alternative Fund drawing $1.6 billion and Alternative LV accumulating $170 million in assets.

Effective December 31, 2015, the Diamond Hill Small Cap Fund (DHSCX) will close to most new investors. Told you so.

On December 31, 2015, the Undiscovered Managers Behavioral Value Fund (UBVAX) will institute a soft close. Shhh! Don’t tell anyone but the undiscovered managers are Russell Fuller and David Potter! And don’t tell David, but Russell is running an even-more undiscovered fund without him: Fuller & Thaler Behavioral Core Equity (FTHAX). The former is a large small cap fund, the latter is small large cap one.

OLD WINE, NEW BOTTLES

Effective October 31, 2015, Aberdeen U.S. Equity Fund became Aberdeen U.S. Multi-Cap Equity Fund.

Effective on or about January 4, 2016, Clearbridge Mid Cap Core will be renamed ClearBridge Mid Cap Fund.

Effective January 1, 2016, Fidelity Medical Delivery Portfolio will be renamed Health Care Services Portfolio and Fidelity Software and Computer Services Portfolio will be renamed Software and IT Services Portfolio.

Effective January 25, 2016, Merk Asian Currency Fund (MEAFX) becomes Merk Chinese Yuan Currency and Income Fund. The fund already reports having 98% of its portfolio in the Chinese currency (and 20.2% in Hong Kong?), so it’s largely symbolic.

On February 24, 2016, the word “Retirement” will be removed from the names of all of the T. Rowe Price Target Retirement Funds (Funds).

OFF TO THE DUSTBIN OF HISTORY

AlphaCentric Smart Money Fund (SMRTX) smartly lost 19% in 15 months of existence, which might explain why its board decided that it’s in “the best interests of the Fund and its shareholders that the Fund cease operations.” Those interests will be expressed in the fund’s liquidation, just before Christmas.

On October 27, Andrew Kerai stepped aside as manager of BDC Income Fund (ABCDX) less than a year after the fund’s launch. Six days later, the fund’s board of trustees voters to close and liquidate it. It disappeared on November 30, 2015, still short of its one-year mark.

Carne Hedged Equity Fund (CRNEX) is liquidating on December 7, 2015. The board forthrightly attributed the closure to “recent Fund performance, the inability of the Fund to garner additional assets, the relatively small asset size of the Fund, recent significant shareholder redemptions, and other factors.” The fund buys mostly household names (Gilead, PayPal, Apple, Michael Kors, IBM) and was doing well until early 2014. Since then it’s dropped 24% in a steadily rising market. Neither the fund’s shareholders nor I know what happened. The 2014 annual report contains one cryptic passage from the manager, “I looked to optimize the hedging without diverting from the core portfolio. This strategy was a poor choice.” The subsequent semi-annual report contains no text and the website offers neither commentary nor shareholder letters.

Catalyst Activist Investor Fund (AIXAX) will liquidate on December 21, 2015. The fund looked to invest in companies where the public filings, typically Form 13D, showed activity by activist investors. The idea is to follow the smart money in, and out. The strategy lost about 25% since its summer 2014 launch. If you’re intrigued by the strategy, there’s still the 13D Activist Fund (DDDAX) which has also lost money on that period but a lot less money.

CRM Global Opportunity Fund (CRMWX) has closed in advance of a December 16, 2015 liquidation.

Curian/PIMCO Income Fund has closed and will cease operations on the as-yet unannounced cessation date.

Dreyfus International Value Fund (DVLAX) merges into Dreyfus International Equity Fund (DIEAX) on January 22, 2016. DIEAX isn’t particularly good but it does have better performance and significantly lower expenses than the liquidating fund.

On December 23, 2015, Forward Tactical Enhanced Fund (FTEEX) becomes the latest attraction at Forward’s LiquidationFest. It takes a 9,956% turnover ratio with it.

Speaking of firm-wide festivities, Franklin is unleashing a bundle of liquidations. For the sake of space, I’ve stuck them in a table.

Fund Fate As of
All Cap Value Merges into Small Cap Value April 1, 2016
Double Tax-Free Income Merges into High Yield Tax-Free Income April 29, 2016
Large Cap Equity Merges with Growth March 11, 2016
World Perspectives Will liquidate February 24, 2016
Multi-Asset Real Return Will liquidate March 1, 2016

Here’s a filing written by a former philosophy major: “On November 12, 2015, Gateway International Fund was liquidated. The Fund no longer exists, and as a result, shares of the Fund are no longer available for purchase or exchange.”

JPMorgan Global Natural Resources Fund (JGNAX) will liquidate on or about December 16, 2015. Over five years, the fund turned a $10,000 initial investment into a $3,500 portfolio.

In January 2016, shareholders will vote on a proposed merger of Keeley Mid Cap Value Fund (KMCVX) into the Keeley Mid Cap Dividend Value Fund (KMDVX). They should approve.

MAI Energy Infrastructure and MLP Fund (VMLPX) will liquidate on December 23, 2015.

MFS Global Leaders Fund was terminated as of November 18, 2015.

RBC Prime Money Market Fund is closing on September 30, 2016 and liquidating shortly thereafter. The combination of zero interest and new liquidity regs are making such filings a lot more common.

SMH Representation Trust (SMHRX) liquidates on December 21, 2015. There’s been a bit of a performance slump of late.

smhrx

I wonder if Morningstar ever looks at these things and thinks “perhaps labeling this chart as growth of $10,000 is a misnomer”?

Sometime in the first quarter of 2016, Templeton BRIC Fund (TABRX) will merge into Templeton Developing Markets Trust (TEDMX).

Thomas Crown Global Long/Short Equity Fund (TCLSX) liquidated on November 13, 2015 following the painful realization that “there are no meaningful prospects for growth in assets.”

Visium Event Driven Fund became driverless on November 27, 2015.

In Closing . . .

We’d like to thank all those who have contributed to MFO. That certainly includes the folks who contributed for premium access, but we’re equally grateful to the folks who made other levels of contribution. To Mitchell, Frank, John, Edward, and Charles, you’re golden!. Thank you, too, to all those who loyally use our Amazon link. It was a good month.

We wish you all a joyous holiday season. We know your families are crazy; hug them all the tighter for it. In the end they matter more than all the trinkets and all the bling and all the toys and all the square footage you’ll ever buy.

We’ll look for you in the New Year.

David

Fidelity Total Emerging Markets (FTEMX), December 2015

By David Snowball

Objective and strategy

FTEMX seeks income and capital growth by investing in both emerging markets equities and emerging markets debt. White their neutral weighting is 60/40 between stocks/bonds, the managers adjust the balance between equity and debt based on which universe is most attractively positioned. In practice, that has ranged between 55% – 75% in equities. Within equities, sector and regional exposure are driven by security selection; they go where they find the best opportunities. The debt portfolio is distinctive; it tends to hold US dollar-denominated debt (a conservative move) but overweight frontier and smaller emerging markets (an aggressive one).

Adviser

Fidelity Investments. Fidelity has a bewildering slug of subsidiaries spread across the globe. Collectively they manage 575 mutual funds, over half of those institutional, and $2.1 trillion in assets.

Managers

John Carlson and a five person team of EM equity folks. Mr. Carlson has managed Fidelity’s EM bond fund, New Markets Income (FNMIX), since 1995. He added Global High Income (FGHIX) in 2011. He was Morningstar’s Fixed-Income Manager of the Year in 2011. He manages $7.8 billion and is supported by a 15 person team. The equity managers are Timothy Gannon, Jim Hayes, Sam Polyak, Greg Lee and Xiaoting Zhao. Gannon, Hayes and Polyak have been with the fund since inception, Lee was added in 2012 and Zhao in 2015. These folks have been responsible since 2014 for Emerging Markets Discovery (FEDDX), a four star fund with a small- to mid-cap bias. They also help manage Fidelity Series Emerging Markets (FEMSX), a four star fund that is only available to the managers of Fidelity funds-of-funds. The equity managers are each responsible for investing in a set of industries: Hayes (financials, telecom, utilities), Polyak (consumer and materials), Lee (industrials), Gannon (health care) and Zhao (tech). They help manage between $2 – 12 billion each.

Management’s stake in the fund

Messrs. Carlson, Gannon and Hayes have each invested between $100,000 and $500,000. Mr. Lee and Mr. Polyak have no investment in the fund. None of the fund’s 10 trustees have an investment in it. While they oversee Fidelity’s entire suite of EM funds, five of the 10 have no investment in any of the EM funds.

Opening date

November 1, 2011

Minimum investment

$2,500

Expense ratio

1.12% on assets of $229.7 million (as of 7/6/2023). 

Comments

Simple, simple, simple.

The argument for considering an emerging markets fund is simple: they offer the prospect of being the world’s best performing asset class over the next 5 or 10 years. In October 2015, GMO estimated that EM stocks (4.0% real return) would be the highest returning asset class over the next 5-7 years, EM bonds (2.2%) would be second. Most other asset classes were projected to have negative real returns. At the same moment, Rob Arnott’s Research Affiliates was more optimistic, suggesting that EM stocks are priced to return 7.9% a year with high volatility compared with 1.1% in the US and 5.3% in the other developed markets. Given global demographics, it wouldn’t be surprising, give or take the wildcard effects of global warming, for them to be the best asset class over the next 50 or 100 years as well.

The argument against considering an emerging markets fund is simple: emerging markets are a mess. Their markets tend to be volatile. 30-60% drawdowns are not uncommon. National economies are overleveraged to commodity prices and their capital markets (banks, bond auctions, stock markets) can’t be relied upon; Andrew Foster, my favorite emerging markets manager and head of the Seafarer fund, argues that broken capital markets are almost a defining characteristic of the emerging markets. Investors yanked over a trillion dollars from emerging markets over the past 12 months.

The argument for investing in emerging markets through a balanced fund is simple: they combine higher returns and lower volatility than you can achieve through 100% equity exposure. The evidence here is a bit fragmentary (because the “e.m. balanced” approach is new and neither Morningstar nor Lipper have either a peer group or a benchmark) but consistent. The oldest EM balanced fund, the closed-end First Trust Aberdeen Emerging Opportunities Fund (FEO), reports that from 2006-2014 a blended benchmark returned 6.9% annually while the FTSE All World Emerging Market Equity Index returned 5.9%. From late 2011 to early 2015, Fidelity calculates that a balanced index returned 5.6% while the MSCI Emerging Markets Index returns 5.1%. Both funds have lower standard deviations and higher since-inception returns than an equity index. Simply rebalancing each year between Fidelity’s EM stock and bond funds so that you end up with a 60/40 weighting in a hypothetical balanced portfolio yields the same result for the past 10- and 15-year periods.

If balanced makes sense, does Fidelity make special sense?

Probably.

Two things stand out. First, the lead manager John Carlson is exceptionally talented and experienced. He’s been running Fidelity New Market Income (FNMIX), an emerging markets bond fund, since 1995. He’s the third longest-tenured EM bond manager and has navigated his fund through a series of crises initiated in Mexico, Asia and Russia. He earned Morningstar’s Fixed-Income Fund Manager of the Year in 2011. $10,000 entrusted to him when I took over FNMIX would have grown to $100,000 now while his average peer would be about $30,000 behind.

Second, it’s a sensible portfolio. Equity exposure has ranged from 55 – 73%. Currently it’s at the lowest in the fund’s history. Mr. Carlson says that “From an asset-allocation perspective, we believe shareholders can expect the sort of downside protection typically afforded by a balanced fund comprising both fixed-income and equity exposure.” He invests in dollar-denominated (so-called “hard currency”) EM bonds, which shields his investors from the effects of currency fluctuations. That makes the portfolio’s bond safety net extra safe. At the same time, he doesn’t hedge his stock exposure and is willing to venture into smaller emerging markets and frontier markets. At least in theory those are more likely to be mispriced than issues in larger markets, and they offer a bit more portfolio diversification. The manager says that “Based on about two decades of research, we found that frontier-markets debt performs much like EM equity.” In general the equity sub-portfolio’s returns are driven by individual security selection. It shows no unusual bias to any region, sector or market cap. “On the equity side, we take a sector-neutral approach that targets high active share, a measure of the percentage of holdings that differ from the index, which historically has offered greater potential for outperformance.”

Since inception in 2011, the strategy has worked. The fund has returned 2.9% a year in very rocky times while its all-equity peers lost money. Both measures of volatility, standard deviation and downside deviation, are noticeably lower than an EM equity fund’s.

ftemx

Bottom Line

I am biased in favor of EM investing. Despite substantial turmoil, it makes sense to me but only if you have a strategy for coping with volatility. Mr. Carlson has done a good job of it, making this the most attractive of the EM balanced funds on the market. There are other risk-conscious EM funds (most notable Seafarer Overseas Growth & Income SFGIX and the hedged Driehaus Emerging Markets Small Cap DRESX) but folks wanting even more of a buffer might reasonably start by looking here.

Fund website

Fidelity Total Emerging Markets

Disclosure: I own shares of FTEMX through my college’s 403b retirement plan and shares of SFGIX in my non-retirement portfolio.

Funds in registration, November 2015

By David Snowball

Frontier Silk Invest New Horizons Fund

Frontier Silk Invest New Horizons Fund will be seek capital appreciation. The plan is to invest in frontier market equities, either directly or through a form of derivative called a participation note. The fund will be managed by Zin El Abidin Bekkali, Olufunmilayo Akinluyi and Mohamed Bahaa Abdeen, all of Silk Invest Limited which is domiciled in London. The opening expense ratio will be 2.0% after waivers and the minimum initial investment is $10,000.

Harbor International Small Cap Fund

Harbor International Small Cap Fund will seek long-term growth of capital. The plan is to invest a diversified portfolio of 80-110 international small cap stocks. “Small” generally equates to “under $5 billion in market cap.” They’re looking for financial sound firms whose earnings have been growing lately and whose “reasonable company valuation indicat[es] a strong upside potential in the stock price over the next 9 to 12 months.” The fund will be managed by a team from Barings International Limited. The opening expense ratio will be 1.32% and the minimum initial investment is $2,500.

LDR Preferred Income Fund

LDR Preferred Income Fund will seek high current income and high risk-adjusted long-term returns. The plan is to invest in preferred shares of REITs, maybe with some interest rate hedges tossed in. Currently this portfolio is manifested in a hedge fund, LDR Preferred Income Fund, LLC, which will roll over and become a mutual fund. No word yet on the hedge fund’s performance. The fund will be managed by Lawrence D. Raiman (LDR) and Gregory Cox, both of LDR Capital Management. Neither the expense ratio nor the minimum initial investment has been revealed, though the existence of an archaic 5.75% front load has been.

Livian Equity Opportunity Fund

Livian Equity Opportunity Fund will seek long-term capital appreciation. The plan is to invest in a portfolio of 30-35 undervalued, mostly domestic, stocks. They’re looking for high quality businesses and some identifiable catalyst that will unlock value. Livian Equity Opportunity Fund already operates as a hedge fund, though its performance record has not yet been released. The fund will be managed by Michael Livian and Stephen Mulholland who currently run the hedge fund. The opening expense ratio has not been disclosed. The minimum initial investment will be $10,000.

TCW New America Premier Equities Fund

TCW New America Premier Equities will seek long-term capital appreciation. The plan is invest in “enduring, cash generating businesses whose leaders the portfolio manager believes prudently manage their environmental, social, and financial resources” and whose shares are relatively cheap. The fund will be managed by Joseph R. Shaposhnik, a senior vice president at TCW. The opening expense ratio not been determined and the minimum initial investment is $2000. That’s reduced to $500 for IRAs.

RiverNorth Core Opportunity (RNCOX/RNCIX), November 2015

By David Snowball

THIS IS AN UPDATE OF THE FUND PROFILE ORIGINALLY PUBLISHED IN June 2011. YOU CAN FIND THAT ORIGINAL PROFILE HERE.

Objective and strategy

The fund seeks long-term capital appreciation and income, while trying to maintain a sense of “prudent investment risk over the long-term.” RNCOX is a “balanced” fund with several twists. First, it adjusts its long-term asset allocation in order to take advantage of tactical allocation opportunities. Second, it invests primarily in a mix of closed-end mutual funds and ETFs. Lipper’s designation, as a Global Macro Allocation fund, provides a more realistic comparison than Morningstar’s Moderate Allocation assignment.

Adviser

RiverNorth Capital Management. RiverNorth is a Chicago-based firm, founded in 2000 with a distinctive focus on closed-end fund arbitrage. They have since expanded their competence into other “under-followed, niche markets where the potential to exploit inefficiencies is greatest.” RiverNorth advises three limited partnerships and the four RiverNorth funds: RiverNorth/Oaktree High Income (RNOTX), Equity Opportunity (RNEOX), RiverNorth/DoubleLine Strategic Income (RNDLX) and this one. They manage about $3.0 billion through limited partnerships, mutual funds and employee benefit plans.

Managers

Patrick Galley and Stephen O’Neill. Mr. Galley is RiverNorth’s President, Chairman and Chief Investment Officer. He also manages all or parts of three RiverNorth funds with Mr. O’Neill. Before joining RiverNorth Capital in 2004, he was a Vice President at Bank of America in the Global Investment Bank’s Portfolio Management group. Mr. O’Neill specializes in qualitative and quantitative analysis of closed-end funds and their respective asset classes. Prior to joining RiverNorth in 2007, he was an Assistant Vice President at Bank of America in the Global Investment Bank’s Portfolio Management group. Messrs Galley and O’Neill manage about $1.7 billion in other pooled assets.

Strategy capacity and closure

The fund holds almost as much money as it did when it closed to new investors. The managers describe themselves as “comfortable now” with the assets in the fund. Three factors would affect their decision to close it again. First, market volatility makes them predisposed to stay open. That volatility feeds the CEF discounts which help drive market neutral alpha. Second, strong relative performance will draw “hot money” again, which they’d prefer to avoid dealing with. Finally, they prefer a soft close which would leave “a runway” for advisors to allocate to their clients.

Active share

“Active share” measures the degree to which a fund’s portfolio differs from the holdings of its benchmark portfolio. High active share indicates management which is providing a portfolio that is substantially different from, and independent of, the index. An active share of zero indicates perfect overlap with the index, 100 indicates perfect independence. RiverNorth does not calculate active share, though the distinctiveness of its portfolio implies a very high level of activity.

Management’s stake in the fund

Messrs. Galley and O’Neill each have between $100,000 – 500,000 in the fund. Three of the four independent trustees have relatively modest ($10,000-100,000) investments in the fund while one has no investments with RiverNorth.

Opening date

December 27, 2006. The fund added an institutional share class (RNCIX) on August 11, 2014.

Minimum investment

$5,000, reduced to $1,000 for IRAs.

Expense ratio

3.56% on assets of $45.2 million, as of July 2023. The expense ratio is heavily influenced by the pass-through expense from the closed-end funds in which it invests. 

Comments

Normally the phrase “balanced fund” causes investor’s eyes to grow heavy and their heads to nod. Traditional balanced funds make a good living by being deadly dull. They have a predictable asset allocation, 60% equities and 40% bonds. And they execute that allocation with predictable investments in blue-chip domestic companies and investment grade bonds. Their returns are driven more by expenses and avoiding mistakes than any great talent.

Morningstar places RiverNorth Core Opportunity there. They don’t belong. Benchmarking them against the “moderate allocation” group is far more likely to mislead than inform.

RiverNorth’s strategy involves pursuing both long- and short-term opportunities. They set an asset allocation then ask whether they see more opportunities in executing the strategy through closed-end funds (CEFs) or low-cost ETFs.  While both CEFs and ETFs trade like stocks, CEFs are more like active mutual funds. Because their price is set by investor demands, a share of a CEF might trade for more than the value of its holdings when greed seizes the market or far less than the value of its holdings when fear does. The managers’ implement their asset allocation with CEFs when they’re available at irrational discounts; otherwise, they use low-cost ETFs.

In general, the portfolio is 50-70% CEFs. Mr. Galley says that it’s rare to go over 70% but they did invest 98% in CEFs toward the end of during the market crisis. That move primed their rocket-like rise in 2009: their 49% gain more than doubled their peer group’s and was nearly double the S&P 500’s 26%. It’s particularly impressive that the fund’s loss in 2008 was no greater than its meek counterparts.

That illustrates an essential point: this isn’t your father’s Buick. It’s distinctive and more opportunistic. Over the fund’s life, it’s handsomely rewarded its investors with outsized returns and quick bounce backs from its declines. Here’s RiverNorth’s performance against the best passive and active options at Vanguard.

rivernorth vs vanguard

The comparison against Rivernorth’s more opportunistic peer group shows an even more stark advantage.

rivernorth

The fund is underwater by 3.4% in 2015, through October 30, after a ferocious October rally. That places them about 3.5% behind their Morningstar peer group. The short-term question for investors is whether that lag represents a failure of RiverNorth’s strategy or another example of the portfolio-as-compressed-spring? The managers observe that CEF discounts widen to levels not seen since the financial crisis. That’s led them to place 76% of the portfolio in CEFs, many that use leverage in their own portfolios. That’s well above their historic norms and implies a considerable confidence on their part.

Bottom Line

Core Opportunity offers unique opportunity, more suited to investors comfortable with an aggressive strategy than a passive one. Since inception, the fund has outperformed the S&P 500 with far less volatility (beta = 76) and has whomped similarly-aggressive funds. That long-term strength comes at the price of being out of step with, and more volatile than, traditional 60/40 funds. That’s making them look weak now. If history is any guide, that judgment is subject to a dramatic and sudden reversal. It’s well worth investigating.

Fund website

RiverNorth Core Opportunity.

[cr2015]

November 1, 2015

By David Snowball

Dear friends,

As you read this, I’ll be wading through a drift of candy wrappers, wondering if my son’s room is still under there somewhere. Weeks ago my local retailers got into the Halloween spirit by setting up their Christmas displays and now I live in terror of the first notes of that first Christmas carol inflicted over storewide and mall-wide sound systems.

But between the two, I pause for thanksgiving and Thanksgiving. I’m thankful for all the things I don’t have: they’re mostly delusion and clutter. I’m thankful for the stores not open on Black Friday (REI most recently) just as I’m thankful for the ones not open on Sundays (Fareway grocery stores, locally); we’ve got to get past the panic and resentment that arises if there’s a whole day without shopping. I’m grateful for those who conspire to keep me young, if only through their contagious craziness. apple pie
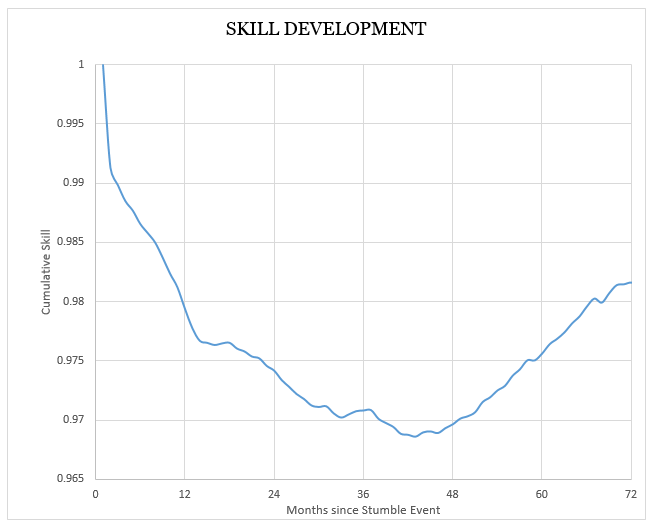
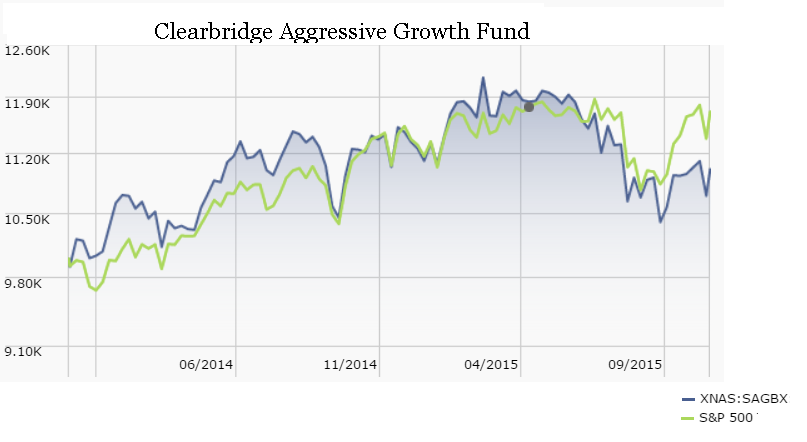
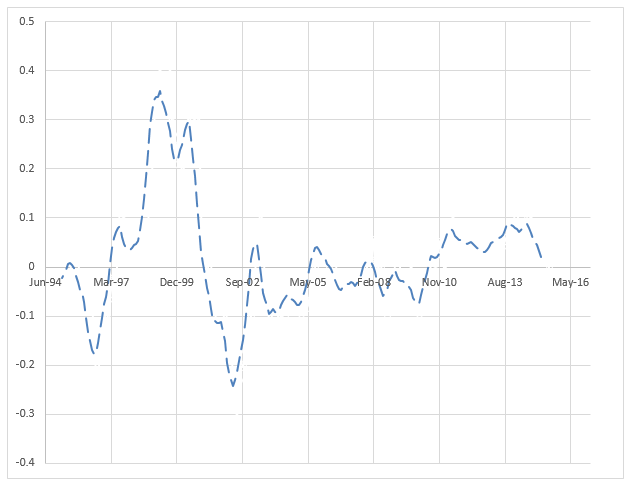
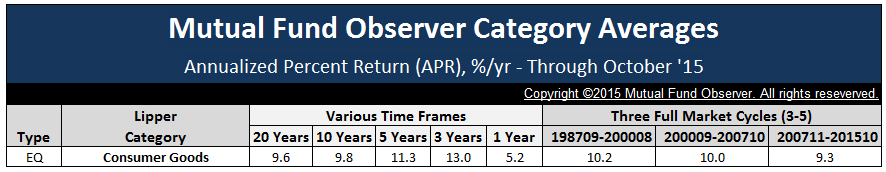
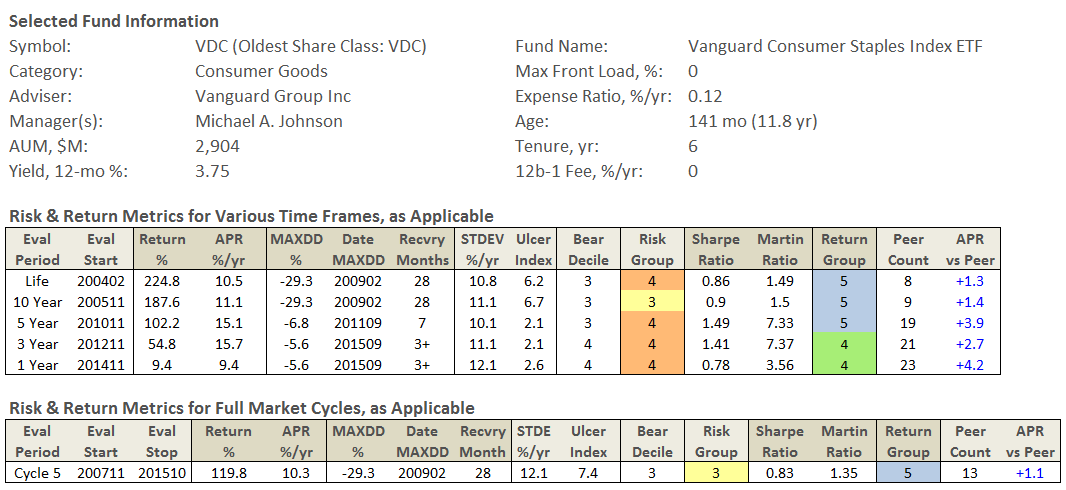
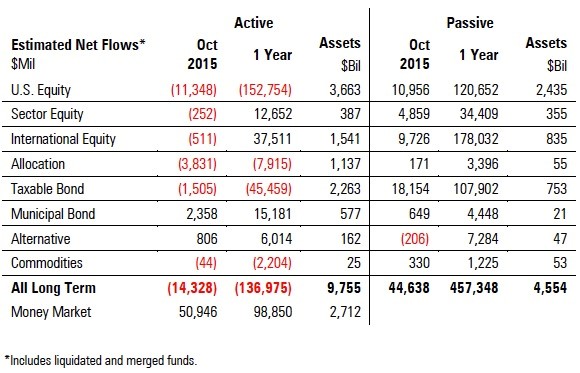
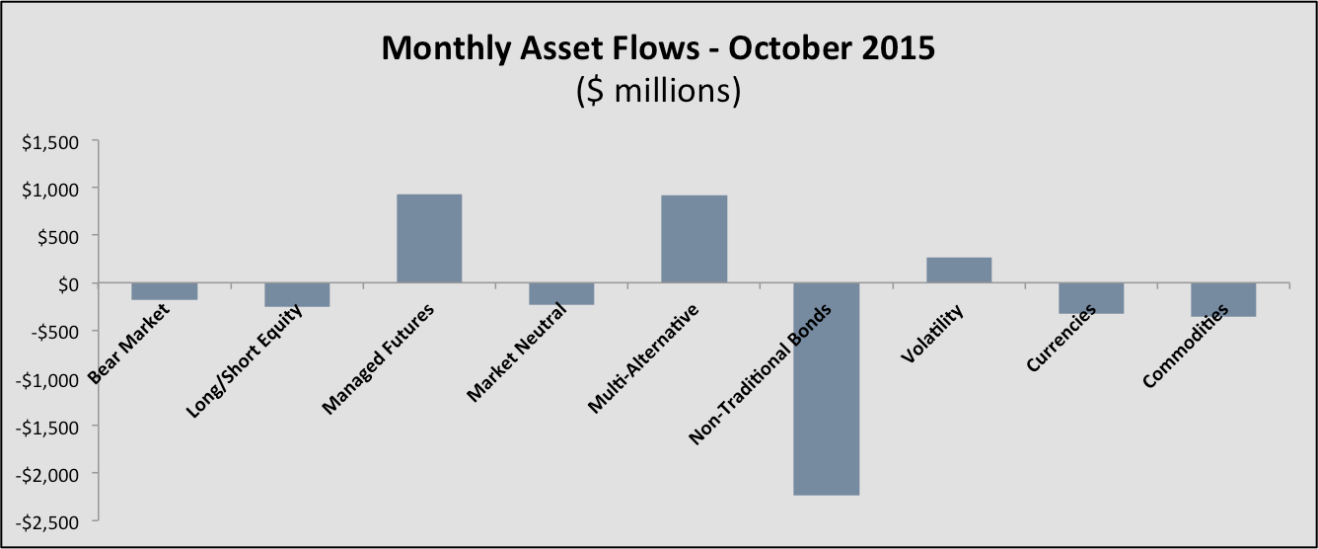
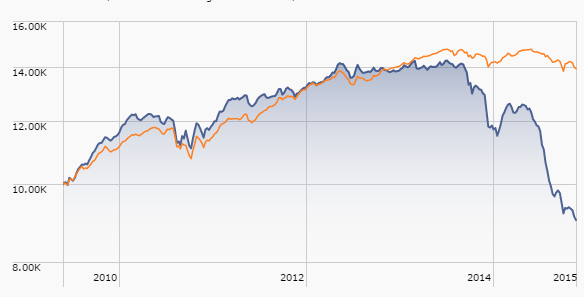
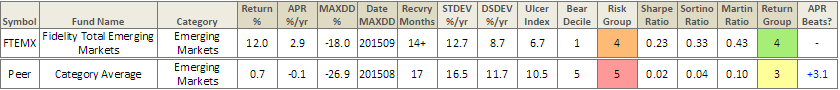
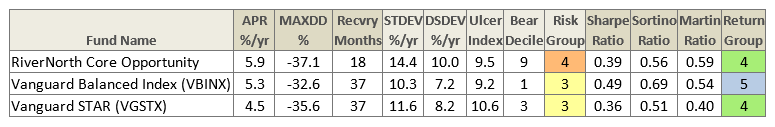
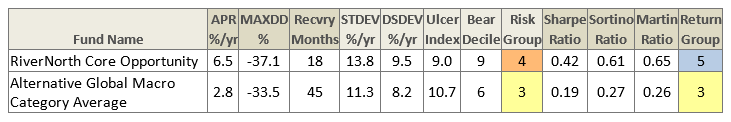
I’m grateful for gravy, for the sweet warmth of a friend hugged close, for my son’s stunning ability to sing and for all the time my phone is turned off.

And I’m grateful, most continually, for the chance to serve you. It’s a rare honor.

Had I mentioned apple pie with remarkably thick and flaky crust? If not, that’s way up on the list too.

There’s a break in the rain. Get up on the roof!

… a bear market is not the base case for most of Wall Street. Adam Shell, 9/29/15

Duh. Cheerleaders lead cheers.

Good news: the sun is out. The Total Stock Market Index (VTSMX) soared 7.84% in October, offsetting a 7.29% decline in the third quarter. It’s now above water for the year, through Halloween, with a return of 1.8%. Optimists note that we’re now in the best six months of the year for stocks, and they anticipate healthy gains.

Bad news: none of the problems underlying the third quarter decline have changed.

We have no idea of whether the market will soar, stagger or crash over the next six months. Any of those outcomes are possible, none are predictable. Morningstar’s John Rekenthaler argues that the market isn’t priced for an imminent crash (“Are US stocks overripe?” 10/30/2015). BlackRock’s chief strategist agrees. The Leuthold Group says it’s “a bear until proven otherwise” but does allow for the prospect of a nice, tradable bounce (10/7/2015).

A lot of fairly serious adults are making the same argument: crash or not, the U.S. stock market is priced for futility.

GMO estimates (as of 10/14/2015) US real returns close to zero over the next 5-7 years. They estimate that high quality stocks might make 1% a year, small caps will be flat and large caps in general will lose nearly 1% a year. Those estimates assume simple reversions to long-term average profit margins and stock prices, both of which have been goofed by the Fed’s ongoing zero rate policy.

Jack Bogle (10/14/2015, warning: another auto-launch video) likewise thinks you’ll make about zero. His calculation is a rougher version of GMO’s. Investment gains are dividends plus earnings growth. An optimist would say 2% and 6%, respectively. Bogle thinks the 6% is too optimistic and pencils-in 5%. You then inflate or deflate the investment returns by changes in valuations. He notes that a P/E of 15 is about normal, so if you buy when the P/E is below 15 you get a boost. If you buy when the P/E is above 15, you get a penalty. By his calculations, the market P/E is about 20.

So you start with a 7% investment return (2% + 5%) and begin making deductions:

  • P/E contraction would cost 3% then
  • inflation might easily cost 2%, and of course
  • fund fees and expenses cost 1%, after which
  • stupid investor behavior eats 1.5%.

That leaves you with a “real” return of about zero (which at least cuts into your tax bill).

Henry Blodget was the poster child for the abuses of the financial markets in the 1990s. He went on to launch Business Insider, which became the web most popular business news site. It (well, 88% of it) was just sold to the German publisher Axel Springer for $340 million.

Blodget published an essay (10/4/2015) which concluded that we should anticipate “weak” or “crappy” returns for the next decade. The argument is simple and familiar to folks here: stocks are “fantastically expensive relative to most of recorded history.” Vigorous government intervention prevented the phenomenal collapse that would have returned market valuations to typical bear market lows, building the base for a decades-long bull. Zero interest rates and financial engineering conspired to keep stocks from becoming appropriately loathed (though it is clear that many institutional investors are, for better or worse, making structural changes in their endowment portfolios which brings their direct equity exposure down into the single digits).

Adding fuel to the fire, Rob Arnott’s group – Research Affiliates – has entered the debate. They are, mildly put, not optimistic about US stocks. Like Leuthold and unlike Blodget, they’re actually charged with finding way to invest billions ($174 billion, in RA’s case) profitably.

Key points from their latest essay:

  1. “High stock prices, just like high house prices, are harbingers of low returns.
  2. Investing in price-depressed residential rental property in Atlanta is like investing in EM equities today-the future expected long-term yield is much superior to their respective high-priced alternatives.
  3. Many parallels exist between the political/economic environment and the relative valuation of U.S. and EM equities in the periods from 1994 to 2002 and 2008 to 2015.
  4. Our forecast of the 10-year real return for U.S. equities is 1% compared to that of EM equities at 8%, now valued at less than half the U.S. C A P E.”

hole in roof from animalsBottom line: Leuthold – bear’s at the door. GMO – pretty much zero, real, with the prospect of real ugliness after the US election. Bogle – maybe 2% real. Blodget – “crap.” Research Affiliates – 1%.
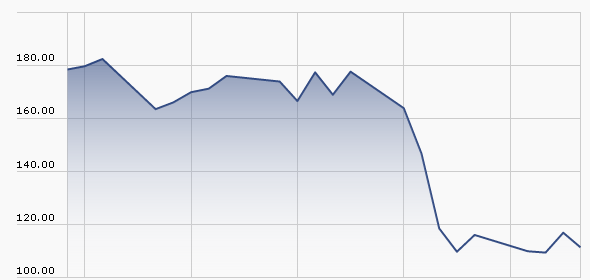
For most of us, that’s the hole in the roof.  

Recommendation One: fix it now, while the sun’s out and you’re feeling good about life. Start by looking at your Q3 losses and asking, “so, if I lost twice that much in the next year and didn’t get it back until the middle of President Trump’s second term, how much would that affect my life plans?” If you lost 3%, imagine an additional 6% and shrug, then fine. If you lost 17%, deduct another 34% from your portfolio and feel ill, get up on the roof now!  In general, simplify both your life and your portfolio, cut expenses when you can, spend a bit less, save a bit more. As you look at your portfolio, ask yourself the simple questions: what was I thinking? Why do I need that there? Glance at the glidepaths for T. Rowe Price’s retirement date funds to see how really careful folks think you should be invested. If your allocation differs a lot from theirs, you need to know why. If you don’t know your allocation or don’t have one, now would be the time to learn.

Recommendation Two: reconsider the emerging markets. Emerging markets have been slammed by huge capital outflows as investors panic over the prospect that China is broken. Over a trillion dollars in capital has fled in fear. The “in fear” part is useful to you since it likely signals an overshoot. The International Monetary Fund believes that the fears of Chinese collapse are overblown. Josh Brown, writing as The Reformed Broker, raises the prospect of that emerging markets may well have bottomed. No one doubts that another market panic in the U.S. will drive the emerging markets down again.

That having been said, there’s also evidence that the emerging markets may hold the only assets offering decent returns over the remainder of the decade. GMO estimates that EM stocks (4.6% real/year) and bonds (2.8% real/year) will be the two highest-returning asset classes over the next five-to-seven years. Research Affiliates is more optimistic, suggesting that EM stocks are priced to return 7.9% a year with high volatility, about 1.1% in the US and 5.3% in the other developed markets. Leuthold finds their valuations very tempting. Bill Bernstein (auto-launch video, sorry), an endlessly remarkable soul, allows “They are cheap; they are not good and cheap …  It’s important for small investors to realize that you can’t buy low unless you are willing to deal with bad news.”

Look for ways of decoupling from the herd, since the EM herd is a particularly volatile bunch. That means staying away from funds that focus on the largest, most liquid EM stocks since those are often commodity producers and exporters whose fate is controlled by China’s. That may point toward smaller companies, smaller markets and a domestic orientation. It certainly points toward experienced managers. We commend Driehaus Emerging Markets Small Cap Growth (DRESX), Seafarer Overseas Growth & Income (SFGIX and Matthews Asia Strategic Income (MAINX) to you.

A second approach is to consider a multi-asset or balanced fund targeting the emerging markets. We know of just a handful of such funds:

  • AB Emerging Markets Multi-Asset Portfolio (ABAEX), AllianceBernstein.
  • Capital Emerging Markets Total Opportunities Fund (ETOPX) – a boutique manager affiliated with the American Funds. Capital Guardian Trust Company
  • Dreyfus Total Emerging Markets (DTMAX)
  • Fidelity Total Emerging Markets (FTEMX)
  • Lazard Emerging Markets Multi-Asset (EMMIX)
  • PIMCO Emerging Multi Asset (PEAWX) The fund was liquidated on 14 July 2015.
  • TCW Emerging Markets Multi-Asset Opportunities (TGMEX)
  • First Trust Aberdeen Emerging Opportunities (FEO), a closed-end fund.

Of the options available, Fidelity makes a surprisingly strong showing. We’ll look into it further for you.

Adviser Fund Q3 1-year 3-year 10-year
Fidelity FTEMX (11.1) (6.8) 0.0  
AllianceBernstein ABAEX (10.2) (3.3) (1.7)  
Capital Group ETOPX (10.2) (8.9) (3.2)  
Dreyfus DTMAX (13.4) (12.3) (2.7)  
First Trust/ Aberdeen FEO @NAV (11.7) (11.2) (4.1)  
Lazard EMMIX (13.1) (13.0) (4.6)  
TCW TGMEX (10.3) (7.2) n/a  
           
Benchmarks EM Bonds (6.3) (7.8) (3.7) 6.8
  EM Equity (15.9) (12.2) (2.2) 5.2
  60/40 EM (12.1) (10.4) (2.8) 5.8
  60/40 US (5.6) 1.6 7.5 5.7

Sequoia: “Has anybody seen our wheels? They seem to have fallen off.”

The most famous active fund seems in the midst of the worst screw-up in its history. The fund invested over 30% of its portfolio in a single stock, Valeant Pharmaceuticals (VRX). Valeant made money by buying other pharmaceutical firms, slashing their overhead and jacking up the prices of the drugs they produced. The day after buying to rights to heart medications Nitropress or Isuprel, Valeant increased their prices by six-fold and three-fold, respectively. Hedge funds, and Sequoia, loved it! Everyone else – including two contenders for the Democratic presidential nomination – despised it.

Against the charge that Valeant’s actions are unethical (they put people’s lives at risk in order to reap a windfall profit that they didn’t earn), Sequoia obliquely promises, “When ethical concerns arise, management tends to address them forthrightly, but in the moment.” I have no idea of what “but in the moment” means.

Then, in October, after months of bleeding value, Valeant’s stock did this:

Valeant chart

That collapse, which cost Sequoia shareholders about 6% in a single day, was pursuant to a research report suggesting that Valeant was faking sales through a “phantom pharmacy” it owned. Separately, Federal prosecutors subpoenaed documents related to Valeant’s drug pricing.

Three things stand out:

There’s a serious question about whether Sequoia management drank the Kool-Aid. One intriguing signal that they weren’t maintaining an appropriate distance from Valeant is a tendency, noted by Lewis Braham in a post to our discussion board, for the Sequoia managers to call Valeant CEO Michael D. Pearson, “Mike.” From a call transcript he pointed to:

Mike does not like to issue equity.

… not that Mike would shy away from taking a price increase.

… early on in Mike’s reign …

I think Mike said the company was going to …

We met with Mike a few weeks ago and he was telling us how with $300 million, you can get an awful lot done.

Mike can get a lot done with very little.

Mike is making a big bet.

On whole, he was “Mike” about three times more often than “Mike Pearson.” He was never “Mr. Pearson” or “the CEO.” There was no other CEO given comparable acknowledgement; in the case of their other investments, it was “Google” or “MasterCard.”

Sequoia’s research sounds a lot like Valeant’s press releases. The most serious accusation against Valeant, Sequoia insists in its opening paragraph, “is false.” That confidence rests on a single judgment: that changes in sales and changes in inventory parallel each other, so there can’t be anything amiss. Ummm … Google “manipulate inventory reporting.” The number of tricks that the accountants report is pretty substantial. The federal criminal investigation of Valeant doesn’t get mentioned. There is no evidence that Sequoia heightened its vigilance as Valeant slowly lost two-thirds of its value. Instead, they merely assert that it’s a screaming buy “at seven times the consensus estimate of 2016 cash earnings.”

Two of their independent directors resigned shortly thereafter. Rather than announcing that fact, Sequoia filed a new Statement of Additional information that simply lists three independent trustees rather than five. According to press reports, Sequoia is not interested in explaining the sudden and simultaneous departure. One director refused to discuss it with reporters; the other simply would not answer calls or letters.

Sequoia vigorously defends both Valeant’s management (“honest and extremely driven”) and its numbers. A New York Times analysis by Gretchen Morgenson is caustic about the firm’s insistence on highlighting “adjusted earnings” which distort the picture of the firm’s health. They are, Morgenson argues, “fantasy numbers.”

Sequoia’s recent shareholder letter concludes by advising Valeant to start managing with “an eye on the company’s long-term corporate reputation.” It’s advice that we’d urge upon Sequoia’s managers as well.

The Price of Everything and the Value of Nothing

edward, ex cathedraBy Edward Studzinski

“The pure and simple truth is rarely pure and never simple.”

                             Oscar Wilde

There are a number of things that I was thinking about writing, but given what has transpired recently at Sequoia Fund as a result of its investment in and concentration in Valeant Pharmaceuticals, I should offer some comments and thoughts to complement David’s. Mine are from the perspective of an investor (I have owned shares in Sequoia for more than thirty years), and also as a former competitor.

Sequoia Fund was started back in 1970. It came into its own when Warren Buffett, upon winding up his first investment partnership, was asked by a number of his investors, what they should do with their money since he was leaving the business for the time being. Buffett advised them to invest with the Sequoia Fund. The other part of this story of course is that Buffett had asked his friend Bill Ruane to start the Sequoia Fund so that there would be a place he could refer his investors to and have confidence in how they would be treated.

Bill Ruane was a successful value investor in his own right. He believed in concentrated portfolios, generally fewer than twenty stock positions. He also believed that you should watch those stock investments very carefully, so that the amount of due diligence and research that went into making an investment decision and then monitoring it, was considerable. The usual course of business was for Ruane, Dick Cunniff and almost the entire team of analysts to descend upon a company for a full day or more of meetings with management. And these were not the kind of meetings you find being conducted today, as a result of regulation FD, with company managements giving canned presentations and canned answers. These, according to my friend Tom Russo who started his career at Ruane, were truly get down into the weeds efforts, in terms of unit costs of raw materials, costs of manufacturing, and other variables, that could tell them the quality of a business. In terms of something like a cigarette, they understood what all the components and production costs were, and knew what that individual cigarette or pack of cigarettes, meant to a Philip Morris. And they went into plants to understand the manufacturing process where appropriate.

Fast forward to the year 2000, and yes, there is a succession plan in place at Ruane, with Bob Goldfarb and Carly Cunniff (daughter of Dick, but again, a formidable talent in her own right who would have been a super investor talent if her name had been Smith) in place as President and Executive Vice President of the firm respectively. The two of them represented a nice intellectual and personality balance, complementing or mellowing each other where appropriate, and at an equal level regardless of title.

Unfortunately, fate intervened as Ms. Cunniff was diagnosed with cancer in 2001, and passed away far too early in life, in 2005. Fate also intervened again that year, and Bill Ruane also passed away in 2005.

At that point, it became Bob Goldfarb’s firm effectively, and certainly Bob Goldfarb’s fund. At the end of 2000, according to the 12/31/2000 annual report, Sequoia had 11 individual stock positions, with Berkshire representing 35.6% and Progressive Insurance representing 6.4%. At the end of 2004, according to the 12/31/2004 annual report, Sequoia had 21 individual stock positions, with Berkshire representing 35.3% and Progressive Insurance representing 12.6% (notice a theme here). By the end of 2008, according to the 12/31/2008, Berkshire represented 22.8% of the fund, Progressive was gone totally from the portfolio, and there were 26 individual stock positions in the fund. By the end of 2014, according to the 12/31/2014 report, Sequoia had 41 individual stock positions, with Berkshire representing 12.9% and healthcare representing 21.4%.

So, clearly at this point, it is a different fund than it used to be, in terms of concentration as well as the types of businesses that it would invest in. In 2000 for instance, there was no healthcare and in 2004 it was de minimis. Which begs the question, has the number of high quality businesses expanded in recent years? The answer is probably not. Has the number of outstanding managements increased in recent years, in terms of the intelligence and integrity of those management teams? Again, that would not seem to be the case. What we can say however, is that this is a Goldfarb portfolio, or more aptly, a Goldfarb/Poppe portfolio, distinct from that of the founders.

Would Buffett, if asked today . . . still suggest Sequoia? My suspicion is he would not . . .

An interesting question is, given the fund’s present composition, would Buffett, if asked today for a recommendation as to where his investors should go down the road, still suggest Sequoia? My suspicion is he would not with how the fund is presently managed and, given his public comments advocating that his wife’s money after his demise should go to an S&P 500 index fund.

A fairer question is – why have I held on to my investment at Sequoia? Well, first of all, Bob Goldfarb is 70 and one would think by this point in time he has proved whatever it was that he felt he needed to prove (and perhaps a number of things he didn’t). But secondly, there is another great investor at Ruane, and that is Greg Alexander. Those who attend the Sequoia annual meetings see Greg, because he is regularly introduced, even though he is a separate profit center at Ruane and he and his team have nothing to do with Sequoia Fund. However, Bruce Greenwald of Columbia, in a Value Walk interview in June of 2010 said Buffett had indicated there were three people he would like to have manage his money after he died (this was before the index fund comment). One of them was Seth Klarman at Baupost. Li Lu who manages Charlie Munger’s money was a second, and Greg Alexander at Ruane was the third. Greg has been at Ruane since 1985 and his partnerships have been unique. In fact, Roger Lowenstein, a Sequoia director, is quoted as saying that he knows Greg and thinks Warren is right, but that was all he would say. So my hope is that the management of Ruane as well as the outside directors remaining at Sequoia, wake up and refocus the fund to return to its historic roots.

Why is the truth never pure and simple in and of itself. We have said that you need to watch the changes taking place at firms like Third Avenue and FPA. I must emphasize that one can never truly appreciate the dynamics inside an active management firm. Has a co-manager been named to serve as a Sancho Panza or alternatively to truly manage the portfolio while the lead manager is out of the picture for non-disclosed reasons? The index investor doesn’t have to worry about these things. He or she also doesn’t have to worry about whether an investment is being made or sold to prove a point. Is it being made because it is truly a top ten investment opportunity? But the real question you need to think about is, “Can an active manager be fired, and if so, by whom?” The index investor need not worry about such things, only whether he or she is investing in the right index. But the active investor – and that is why I will discuss this subject at length down the road.

Dancing amidst the elephants: Active large core funds that earn their keep

leigh walzerBy Leigh Walzer

Last month in these pages we reviewed actively managed utility funds. Sadly, we could not recommend any of those funds. Either they charged too much and looked too much like the cheaper index funds or they strayed far afield and failed to distinguish themselves.

We are not here to bury the actively managed fund industry. Trapezoid’s goal is to help investors and allocators identify portfolio managers who have predictable skill and evaluate whether the fees are reasonable. Fees are reasonable if investors can expect with 60% confidence a better return with an active fund than a comparable passive fund. (Without getting too technical, the comparable fund is a time-weighted replication portfolio which tries to match the investment characteristics at a low cost.)

An actively-managed fund’s fees are reasonable if you have at least a 60% prospect of outperforming a comparable passive fund

To demonstrate how this works, we review this month our largest fund category, large blend funds. (We sometimes categorize differently than Morningstar and Lipper. We categorize for investors’ convenience but our underlying ratings process does not rely on performance relative to a peer group.)

We found 324 unique actively-managed large blend funds where the lead manager was on the job at least 3 years.

We recently posted to the www.fundattribution.com website a skill rating for each of these funds. Our “grades” are forward-looking and represent the projected skill decile for each fund over the 12 months ending July 2016.  “A” means top 10%; “J” is bottom 10%. In our back-testing, the average skill for funds rated A in the following year exceeded the skill for B-rated funds, and so on with the funds rated J ranking last. Table I presents the grades for some of the largest funds in the category.  For trapezoid logoexample, the Fidelity Puritan Fund is projected to demonstrate more skill in the coming year than 80-90% of its peer group.

MFO readers who want to see the full list can register for demo access at no cost. (The demo includes a few fund categories and limited functionality.)  Demo users can also see backtesting results.

Table I

Skill Projections for Major US Large Blend Funds

Funds AUM ($bn) Decile
American Funds Inv. Co. of America 69 C
Amer. Funds Fundamental Investors Fund 68 D
Dodge & Cox Stock Fund 56 D
Vanguard Windsor II Fund 44 H
Fidelity Advisor New Insights Fund 26 A
Fidelity Puritan Fund 24 B
Vanguard Dividend Growth Fund 24 H
BlackRock Equity Dividend Fund 22 J
Oakmark Fund 17 B
Davis New York Venture Fund 14 G
John Hancock Disciplined Value Fund 13 E
Invesco Comstock Fund 12 G
JPMorgan US Equity Fund 12 D
Parnassus Core Equity Fund 11 A
JPMorgan US Large-Cap Core Plus Fund 11 A

A few caveats:

  • Our grades represent projected skill, not performance. Gross return reflects skill together with the manager’s positioning. Fund expenses are considered separately.
  • The difference in skill level between an E and F tends to be small while at the extremes the difference between A and B or I and J is larger.
  • Generally, deciles A through E have positive skill while F thru J are negative. The median fund may have skill which is slightly positive. This occurs because of survivorship bias: poorly managed funds are closed or merged out of existence
  • We do not have a financial interest in any of these funds or their advisors

Of course, costs matter. So we ran 1900 large blend fund classes through our Orthogonal Attribution Engine (OAE) to get the probability the investment would outperform its replication portfolio by enough to cover expenses. The good news (for investors and the fund industry) is there are some attractive actively managed funds. Our analysis suggest the fund classes in Table II will outperform passive funds, despite their higher fees.

Table II

Highly-rated Large blend Fund Classes (based on skill through July 2015)

table II

[a]   Morningstar ratings as of 10/20/15. G means gold (e.g. 5G means 5stars and “Gold”), S is silver, B is bronze

[b]   For those of you who like ActiveShare, OAI provides a measure of how active each fund is.  A closet indexer should have an OAI near zero. If we can replicate the fund, even with more complicated techniques, it will also score low. Funds which are highly differentiated can score up to 100.

[c]    Red funds are closed to new investors. Green are limited to institutional investors and retirement plans. Blue are limited to retirement plans

The bad news is that top-rated fund, Vanguard PrimeCap (VPCCX), is closed to new investors. So, too, is Vulcan Value Fund (VVPLX).  Fortunately, the PRIMECAP Odyssey Stock Fund (POSKX) is open and accessible to most investors.  Investors have 66% confidence this fund will generate excess return next year after considering costs. The Primecap funds have done well by overweighting pharma and tech over utilities and financials and have rotated effectively into and out of high-dividend stocks.

In many cases only the institutional or retirement classes are good deals for investors. For example, the Fidelity Advisor New Insights Fund classes I and Z offer 70% confidence; but a new investor who incurs the higher fees/load for classes A, B, C, and T would be less than 55% confident of success. Of course investors who already paid the load should stay the course.

While all these funds are worthy, we have space today to profile just a few funds.

Sterling Capital Special Opportunities Fund (BOPIX, BOPAX, etc.) is just under $1 billion. This fund was once known as BB&T Special Opportunities Equity Fund and was rated five-stars by Morningstar. The rating of the A class later fell to 3 stars and recently regained four-stars. 

Table III

Return Attribution: Sterling Capital Special Opportunities Fund

table III

Special Opps’ gross return was 22% before expenses over the past 3 years. (Table III) Even after fees, returns trounced the S&P500 by over 300bps for the past 3 years and over the past 10 years. The one and 5 year comparisons are less favorable but still positive. Combined skill has been consistently positive over the twelve year history of the fund.

However, that doesn’t tell the whole story. Comparing this to the S&P500 (or the Russell 1000) is neither accurate nor fair. The replicating portfolio – i.e., the one the OAE chooses as the best comparison – is approximately 90% equities (mostly the S&P500 with a smattering of small cap and hedged international which has decreased over time) plus 25% fixed income. The fixed income component surprised us at first, because the portfolio includes no bonds and does not utilize leverage. But the manager likes to write covered calls to generate extra income. We observe he sells about 5% of the portfolio on average about 10 to 20% out of the money. In this way he probably generates premium income of 25bp/yr., which the fixed income component captures well.  As always, the model evaluates the manager based on what he actually does, rather than against his stated benchmark (Russell 1000) or peer group.

Option writing helps explain why his beta is lower (We estimate .89, you will find other figures as low as .84.)  In the eyes of the Orthogonal Attribution Engine, that makes his performance more remarkable. We are not quite so impressed to pay an upfront 5.75% load for BOPAX (Class A), but BOPIX rates well. BOPAX is available no-load and NTF through Schwab and several smaller brokerages.

We had an opportunity to speak to the manager, George Shipp. Table III shows his skill derives much more from stock selection than sector rotation, a view he shared.  We can make a few observations.   He has a team of experienced generalists and a lot of continuity. His operation in Virginia Beach is separate from the other Sterling/BB&T operations in North Carolina.  He also manages Sterling Capital Equity Income (BAEIX), a much larger fund with zero historical overlap. The team follows a stable of companies, mainly industry leaders. They like to buy when the stock is dislocated and they see a catalyst.  The investment process is deliberative. That sounds like a contrarian, value philosophy, but in fact they have an even balance of growth and value investments. We reviewed his portfolio from 5 years ago, several of the top holdings trounced the market. (The exceptions were energy stocks.) Shipp noted he had good timing buying Apple when it was pummeled. He doesn’t specifically target M&A situations, but his philosophy puts the fund in a position to capture positive event risk. It is not unusual for the fund to own the same company more than once.

We also had a chance to speak to the folks at Davis Opportunity Fund (RPEAX). What jumps out about this $530mm fund is their ability to grind out excess return of 1 to 1.25% /yr. for nearly twenty years.  It is no great feat that DGOYX net returns just match the S&P500 for the past 5 years but they managed to do this despite two tailwinds: a 20% foreign allocation (partly hedged) and moderate cash balances. There is an old saw: “You can’t eat relative performance.” But when a fund shows positive relative performance for two decades with some consistency the Orthogonal model concludes the manager is skillful and some of that skill might carry over to the future.   We are willing to pay an incremental 60bp for their institutional class compared with an index fund but we cannot recommend the other share classes. A new co-manager was named in 2013, we see no drop-off in performance since then. (As with Sterling, the team manages a $15bn fund called Davis NY Venture (NYVTX) which does not rate nearly as well; there is some performance correlation between the two funds.)

Their process is geared toward global industry leaders and is somewhat thematic.  OAI of 24 indicates they run a very concentrated portfolio which cannot be easily replicated using passives. (We will talk more about OAI in the future.) Looking back at their portfolio from 5 years ago, their industry weightings were favorable and they did very well with CVS and Google but took hits from Sino Forest (ouch!) and Blount.

In general, the expected skill for a purely passive large blend fund will be close to zero and the probability will be around 50%. (There are exceptions including funds which don’t track well against our indices.)  However, there are a number of quantitatively driven and rules-based funds competing in the large blend space which show skill and some make our list

Table IV

Highly-Rated Large Blend Quantitative Funds

Fund Repr. Class Class Prob Hi-Rated Classes
American Century Legacy Large-Cap Fund ACGOX 72% Instl Inv Adv
PowerShares Buyback Achievers Portfolio PKW 64%  
Wells Fargo Large-Cap Core Fund EGOIX 63% I
Vanguard Structured Broad Market Fund VSBMX 62% I
AMG FQ Tax-Managed US Equity Fund MFQTX 62% Instl
Vanguard Structured Large-Cap Equity Fund VSLPX 61% InstlPlus

We are a little cautious in applying the model to quantitative funds. We know from backtesting that smart managers tend to stay smart, but there is a body of view that good quantitative strategies invite competition and have to be reinvented every few years. Nevertheless, here are the top-rated quant funds. All funds in Table IV carry five-star ratings from Morningstar except ACGOX is rated four-stars)

We had a chance to speak to the team managing American Century Legacy Large Cap (ACGOX), led by John Small and Stephen Pool in Kansas City.  Their approach is to devise models which predict what stock characteristics will work in a given market environment and load up on those stocks. There is some latitude for the managers to override the algorithms. Note this fund is rather small at $23 mm. The fund was evaluated based on data since management started in 2007.  However, the model was overhauled from 2010-2012 and has been tweaked periodically since then as market conditions change. The same team manages three other funds (Legacy Multicap, Legacy Focused, and Veedot); since 2012 they have used the same process, except they apply it to different market sectors.

Bottom Line:

If you are ready to throw in the towel on active funds, you are only 94% right.  There are a few managers who offer investors a decent value proposition. Mostly these managers have sustained good records over long periods with moderate expense levels.   Our thinking on quant funds will evolve over time. Based on our look at American Century Legacy, we suggest investors evaluate these managers based on the ability to react and adapt their quant models rather and not focus too much on the current version of the black box.   Remember to check out our fearless predictions for the entire large blend category at www.fundattribution.com (registration required)

If you have any questions, drop me a line at lwalzer@fundattribution.com

Five great overlooked little funds

Barron’s recently featured an article by journalist Lewis Braham, entitled “Five great overlooked little funds” (10/17/2015). Lewis, a frequent contributor of the Observer’s discussion board, started by screening for small (>$100 milllion), excellent (top 20% performance over five years) funds, of which he found 173. He then started doing what good journalists do: he dug around to understand when and why size matters, then started talking with analysts and managers. His final list of worthies is:

  • SSgA Dynamic Small Cap(SSSDX) which has been added to Morningstar’s watchlist. A change of management in 2010 turned a perennial mutt into a greyhound. It’s beaten 99% of its peers and charged below average expenses.
  • Hood River Small-Cap Growth(HRSRX) has $97 million but “its 14.1% annualized five-year return beats its peers by 2.3 percentage points a year.” The boutique fund remains small because, the manager avers, “We’re stockpickers, not marketers.”
  • ClearBridge International Small Cap(LCOAX), sibling to a huge domestic growth fund, has a five-year annualized return of 8.5%, which beats 95% of its peers. It has $131 million in assets, 1% of what ClearBridge Aggressive Growth (SHRAX) holds.
  • LKCM Balanced (LKBAX) holds an inexpensive, low-turnover portfolio of blue-chip stocks and high-grade bonds. It’s managed to beat 99% of its peers over the past decade while still attracting just $37 million.
  • Sarofim Equity (SRFMX) is a virtual clone of Dreyfus Appreciation (DGAGX). Both buy ultra-large companies and hold them forever; in some periods, the turnover is 2%. It has a great long-term record and a sucky short-term one.

lewis braham
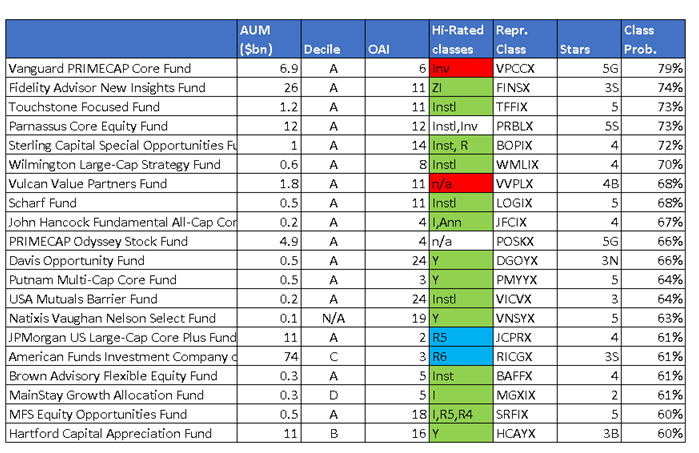
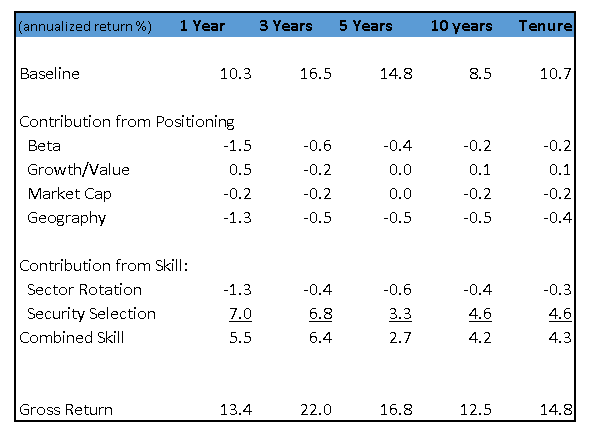
Lewis is also the author of The House that Bogle Built: How John Bogle and Vanguard Reinvented the Mutual Fund Industry(2011), which has earned a slew of positive, detailed reviews on Amazon. He is a graceful writer and lives in Pittsburgh; I’m jealous of both. Then, too, when I Googled his name in search of a small photo for the story I came up with

To which I can only say, “wow.”

Here Mr. Herro, have a smoke and a smile!

After all, science has never been able to prove that smoking is bad for you. Maureen O’Hara, for example, enjoyed the pure pleasure of a Camel:

maureen ohara camel ad

And she passed away just a week ago (24 October 2015), cancer-free, at age 95. And the industry’s own scientists confirm that there are “no adverse effects.”

chesterfield ad

And, really, who’d be in a better position to know? Nonetheless, the Association of National Advertisers warns, this “legal product in this country for over two centuries, manufactured by private enterprise in our free market system” has faced “a fifty-year conspiracy” to challenge the very place of cigarettes in the free enterprise system. The debate has “lost all sense of rationality.”

It’s curious that the industry’s defense so closely mirrors the federal court’s finding against them. Judge Marion Kessler, in a 1700 page finding, concluded that “the tobacco industry has engaged in a conspiracy for decades to defraud or deceive the public … over the course of more than 50 years, defendants lied, misrepresented and deceived the American public … suppress[ed] research, destroyed documents, destroyed the truth and abused the legal system.”

David Herro is the famously successful manager of Oakmark International (OAKIX), as well as 13 other funds for US or European investors. Two of Mr. Herro’s recent statements give me pause.

On climate change: “pop science” and “environmental extremism”

In an interview with the Financial Times, Mr. Herro denounced the 81 corporate leaders, whose firms have a combined $5 trillion market cap, who’d signed on to the White House Climate Pledge (“Fund manager David Herro criticizes corporate ‘climate appeasers,’” 10/21/15). The pledge itself has an entirely uncontroversial premise:

…delaying action on climate change will be costly in economic and human terms, while accelerating the transition to a low-carbon economy will produce multiple benefits with regard to sustainable economic growth, public health, resilience to natural disasters, and the health of the global environment.

As part of the pledge, firms set individual goals for themselves. Coke wants to reduce its carbon footprint by 25%. Facebook promises to power its servers with power from renewables. Bloomberg would like to reduce its energy use by half while achieving an internal rate of return of 20% or more on its energy investments.

To which Mr. Herro roars: “climate appeasers!” They had decided, he charged, to “cave in to pop science and emotion.” Shareholders “should seriously question executives who appease such environmental extremism and zealotry.”

Like others on his island, he engages in a fair amount of arm-flapping. Climate change, he claims, “is not proven by the data.” The Grist.org project, “How to Talk to Climate Deniers” explains the problem of “proof” quite clearly:

There is no “proof” in science — that is a property of mathematics. In science, what matters is the balance of evidence, and theories that can explain that evidence. Where possible, scientists make predictions and design experiments to confirm, modify, or contradict their theories, and must modify these theories as new information comes in.

In the case of anthropogenic global warming, there is a theory (first conceived over 100 years ago) based on well-established laws of physics. It is consistent with mountains of observation and data, both contemporary and historical. It is supported by sophisticated, refined global climate models that can successfully reproduce the climate’s behavior over the last century.

Given the lack of any extra planet Earths and a few really large time machines, it is simply impossible to do any better than this.

But Mr. Herro has a reply at hand: “Their answer is … per cent of scientists and Big Oil. My answer is data, data, data.

What does that even mean, other than the fact that the undergrad science requirement for business majors at Mr. Herro’s alma mater (lovely UW-Platteville) ought to be strengthened? Is he saying that he’s competent to assess climatological data? That he can’t find any data? (If so, check NASA’s “evidence” page here, sir.) That the data’s not perfect? Duh. That you’ve found the data, data, data straight from the source: talk radio and self-published newsletters? Or that there’s some additional bit not provided by the roughly 14,000 peer-reviewed studies that have corroborated the science behind global warming?

Can you imagine what would happen if you used to same criteria for assessing evidence about investments?

None of which I’d mention except for the fact that Herro decided to expand on the subject in his Financial Times interview which moves the quality of his analysis from the realm of the personal to the professional.

waitbutwhyIn my endless poking around, I came upon a clear, thoughtful, entertaining explanation of global warming that even those who aren’t big into science or the news could read, enjoy and learn from. The site is Wait But Why and it attempts to actually explain things (including sad millennials and procrastination) using, well, facts and humor.

Climate Change is a Thing

Let’s ignore all the politicians and professors and CEOs and filmmakers and look at three facts.

  1. Burning Fossil Fuels Makes Atmospheric CO2 Levels Rise
  2. Where Atmospheric CO2 Levels Go, Temperatures Follow
  3. The Temperature Doesn’t Need to Change Very Much to Make Everything Shitty

In between our essays, you should go peek at the site. If you can understand the designs on the stuff in their gift shop, you really should drop me a note and explain it.

On emerging markets: “never again”

In an interview with the Associated Press (“answers have been edited for clarity”), Mr. Herro makes a statement that’s particularly troubling for the future of the Oakmark funds. The article, “Fund manager touts emerging-market stocks” (10/25/15), explains that much of the success of Oakmark International (OAKIX) was driven by Mr. Herro’s prescient and substantial investment in emerging markets:

If we back up to 1998 or 1999, during the Asian financial crisis, we had 25 or 26% of the portfolio in emerging markets. We built up a huge position and we benefited greatly from that the whole next decade. It was the gift that kept giving.

The position was eventually reduced as he harvested gains and valuations in the emerging markets were less attractive. The logical question is, would the fund be bold enough to repeat the decision that “benefited [them] greatly” for an entire decade. Would he ever go back to 25%.

No, no, no. It could come up to 10 or 15% … but we’ll try to cap it there because, nowadays, people use managers (who are dedicated to emerging markets). And we don’t bill ourselves as an emerging-market manager.

This is to say, his decisions are now being driven by the demands of asset gathering and retention, not by the investment rationale. He’ll cap his exposure at perhaps half its previous peak because “people” (read: large investment advisers) want their investments handled by specialists. Having OAKIX greatly overweighted in EMs, even if they were the best values available, would make the fund harder to sell. And so they won’t do it.

Letting marketability drive the portfolio is a common decision, but hardly an admirable one.

A picture for the Ultimus Client Conference folks

At the beginning of September, I had the opportunity to irritate a lot of nice people who’d gathered for the annual client conference hosted by Ultimus Fund Services. My argument about the fund industry was two-fold:

  1. You’re in deep, deep trouble but
  2. There are strategies that have the prospect of reversing your fortunes.

Sometimes the stuff we publish takes three or four months to come together. Our premium site has a feature called “Works in Progress.” It’s the place that we’ll share stuff that’s not ready for publication here. Between now and year’s end, we’ll be posting pieces of the “how to save yourself” essay bit-by-bit.

But that’s not what most folks at the conference wanted to talk about. No, for 12 hours after my talk, the corporate managers at various fund companies and advisers brought up the same topic: I have no idea of how to work with the Millennials in my office. They have no sense of time, urgency, deadlines or focus. What’s going on with these people? All of that was occasioned by a single, off-hand comment I’d made about the peculiar decisions made by a student of mine.

We talked through the evidence on evolving cultural norms and workplace explanations, and I promised to try to help folks find some useful guidance. I found a great explanation of why yuppies are unhappy in an essay at WaitButWhy, the folks above. After explaining why young folks are delusional, they illustrated the average Millennial’s view of their career trajectory:

millennial expectations

If you’ve been banging your head on the desk for a while now, you should read it. You’ll feel better. Pwc, formerly Price, Waterhouse, Cooper, published an intricate analysis (Millennials at work 2015) of Millennial expectations and strategies for helping them be the best they can be. They also published a short version of their recommendations as How to manage the millennials (2015). Scholars at Harvard and the Wharton School of Business are rather more skeptical, taking the counter-intuitive position that there are few real generational differences. Their sources seem intrigued by the notion of work teams that combine people of different generations, who contrasting styles might complement and strengthen one another.

It’s worth considering.

Jack and John, Grumpy Old Men II

Occasionally you encounter essays that make you think, “Jeez, and I thought I was old and grouchy.” I read two in quick, discouraging succession.

grumpyJack Bogle grouched, “I don’t do international.” As far as I can tell, Mr. Bogle’s argument is “the world’s a scary place, so I’m not going there.” At 86 and rich, that’s an easy and sensible personal choice. For someone at 26 or 36 or 46, it seems incredibly short-sighted. While he’s certainly right that “Outside of the U.S., you can be very disappointed,” that’s also true inside the United States. In an oddly ahistoric claim, Bogle extols our 250 year tradition of protecting shareholders rights; that’s something that folks familiar with the world before the Securities Act of 1934 would find freakishly ill-informed.

A generation Mr. Bogle’s junior, the estimable John Rekenthaler surveyed the debate concerning socially responsible investing (alternately, “sustainable” or “ESG”) and grumped, “The debate about the merits of the genre is pointless.” Why? Because, he concludes, there’s no clear evidence that ESG funds perform differently than any other fund. Exactly! We reviewed a lot of research in “It’s finally easgrouchyy being green” (July 2015). The overwhelming weight of evidence shows that there is no downside to ESG investing. You lose nothing by way of performance. As a result, you can express your personal values without compromising your personal rate of return. If you’re disgusted at the thought that your retirement is dependent on addicting third world children to cigarettes or on clearing tropical forests, you can simply say “no.” We profiled clear, palatable investment choices, the number of which is rising.

The freak show behind the curtain: 25,000 funds that you didn’t even know existed

Whatever their flaws (see above), mutual funds are relatively stable vehicles that produce reasonable returns. Large cap funds, on average and after expenses, have returned 7.1% over the past 15 years which puts them 70 bps behind the S&P 500 for the same period.

But those other 25,000 funds …

Which others? ETFs? Nope. There are just about 1,800 of them – with a new, much-needed Social Media Sentiment Index ETF on the way (whew!) – controlling only $3 trillion. You already know about the 7,700 ’40 Act funds and the few hundred remaining CEFs are hardly a blip (with apologies to RiverNorth, to whom they’re a central opportunity).

No, I mean the other 24,725 private funds, the existence of which is revealed in unintelligible detail in a recent SEC staff report entitled Private Fund Statistics, 4th Quarter 2014 (October 2015). That roster includes:

  • 8,625 hedge funds, up by 1100 since the start of 2013
  • 8,407 private equity funds, up by 1400 in that same period
  • 4,058 “other” private funds
  • 2,386 Section 4 private equity funds
  • 1,789 real estate funds
  • 1,541 qualifying hedge funds
  • 1,327 securitized asset funds
  • 504 venture capital funds
  • 69 liquidity funds
  • 49 Section 3 liquidity funds, these latter two being the only categories in decline

The number of private funds was up by 4,200 between Q1/2013 and Q4/2014 with about 200 new advisers entering the market. They have $10 trillion in gross assets and $6.7 trillion in net assets. (Nope, I don’t know what gross assets are.) SEC-registered funds own about 1% of the shares of those private funds.

If Table 20 of the SEC report is to be credited, almost no hedge ever uses a high-frequency trading strategy. (You’ll have to imagine me at my desk, nodding appreciatively.)

Sadly, the report explains nothing. You get tables of technical detail with nary a definition nor an explanation in sight. “Asset Weighted-Average Qualifying Hedge Fund Investor and Portfolio Liquidity” assures that that fund liquidity at seven days is about 58% while investor liquidity in that same period is about 15%. Not a word anywhere freakshowabout what that means. An appendix defines about 10 terms, no one of which is related to their data reports.

A recent report in The Wall Street Journal does share one crucial bit of information: equity hedge funds don’t actually make money for their investors. The HRFX Equity Hedge Fund Index is, they report, underwater over the past decade. That is, “if you have invested … in this type of fund 10 years ago, you would have less than you started with.” An investment in the S&P 500 would have doubled (“Funds wrong-footed as Glencore, others gain,” 10/31/2015).

About a third of hedge funds fold within three years of launch; the average lifespan is just five years. Unlike the case of mutual funds, size seems no guardian against liquidation. Fortress Investment Group is closing its flagship macro fund by year’s end as major domo Michael Novogratz leaves. Renaissance Capital is closing their $1.3 billion futures fund. Bain Capital is liquidating their Absolute Return Capital fund. Many funds, including staunch investors in Valeant such as William Ackman of Pershing Square, are having their worst year since the financial crisis. As a group, they’re underwater for 2015.


Hedge Fund, n. Expensive and exclusive funds numbering in the thousands, of which only about a hundred might be run by managers talented enough to beat the market with consistency and low risk. “The rest,” says the financial journalist Morgan Housel, “charge ten times the fees of mutual funds for half the performance of index funds, pay half the income-tax rates of taxi drivers, and have triple the ego of rock stars. Jason Zweig, The Devil’s Financial Dictionary (2015)


Matching your funds and your time horizon

The Observer has profiled, and praised, the two RiverPark funds managed by David Sherman of Cohanzick. The more conservative, RiverPark Short Term High Yield (RPHYX/RPHIX, closed), usually makes 300-400 bps over a money market fund with scarcely more volatility. Year-to-date, through Halloween, the fund has returned a bit over 1% in a difficult market. The slightly more aggressive, RiverPark Strategic Income (RSIVX/RSIIX) might be expected to about double its sibling’s return with modest volatility, a feat that it has managed regularly. Strategic has had a performance hiccup lately; leading some of the folks on our discussion board to let us know that they’d headed for the exits.

For me, the questions are (1) is there a systemic problem with the fund? And (2) what’s the appropriate time-frame for assessing the fund’s performance? I don’t see evidence of the former, though we’re scheduled to meet Mr. Sherman in November and will talk more.

On the latter, the Observer’s fund-screener tracks “recovery times” for every fund over 20 time periods. Carl Bacon, in the book, Practical Risk Advanced Performance Measurements (2012), defines recovery time, or drawdown duration, as the time taken to recover from an individual or maximum drawdown to the original level. Recovery time helps investors approximate reasonable holding periods and also assessment periods. If funds of a particular type have recovery times of, say, 18-24 months, then (1) it would be foolish to use them for assets you might need in less than 18-24 months and (2) it would be foolish to panic if it takes them 18-24 months to recover.

Below, for comparison, are the maximum recovery times for the flexible bond funds that Morningstar considers to be the best.

Gold- and Silver-rated Flexible bond funds

Name

Analyst Rating

Recovery Period, in months

2015 returns, through 10/30

Loomis Sayles Bond (LSBDX)

Gold

17

(3.59)

Fidelity Strategic Income (FSICX)

Silver

14

0.78

Loomis Sayles Strategic Income (NEZYX)

Silver

23

(3.98)

PIMCO Diversified Income (PDIIX)

Silver

15

3.17

PIMCO Income (PIMIX)

Silver

18

3.49

Osterweis Strategic Income (OSTIX)

Silver

9

1.65

The Observer has decided to license data for our fund screener from Lipper rather than Morningstar; dealing with the sales rep from Morningstar kept making my systolic soar. Within about a week the transition will be complete. The difference you’ll notice is a new set of fund categories and new peer groups for many funds. Here are the recovery times for the top “flexible income” and “multi-sector” income funds, measured by Sharpe ratio over the current full market cycle (11/2007 – present). This screens out any fund that hasn’t been around for at least eight years.

Name

Category

Recovery Period, in months

Full cycle Sharpe ratio

PIMCO Income (PIMIX, a Great Owl)

Multi-sector

18

1.80

Osterweis Strategic Income (OSTIX)

Multi-sector

9

1.35

Schwab Intermediate Bond (SWIIX)

Multi-sector

16

1.25

Neuberger Berman Strategic Income (NSTLX)

Multi-sector

8

1.14

Cutler Fixed Income (CALFX)

Flexible income

15

1.02

FundX Flexible Income (INCMX)

Multi-sector

18

1.00

Bottom line: Before you succumb to the entirely understandable urge to do something in the face of an unexpected development, it’s essential to ask “am I being hasty?” Measures such as Recovery Time help, both in selecting an investment appropriate to your time horizon and in having reasonable criteria against which to assess the fund’s behavior.


Last fall we were delighted to welcome Mark Wilson, Chief Investment Officer for The Tarbox Group which is headquartered in Newport Beach, California. As founder and chief valet for the website CapGainsValet, Mark provided a remarkable service: free access to both thoughtful commentaries on what proved to be a horror of a tax season and timely data on hundreds of distributions. We’re more delighted that he agreed to join us again for the next few months.

Alive and kicking: The return of Cap Gains Valet

capgainsvaletBy Mark Wilson, APA, CFP®, Chief Valet

CapGainsValet.com is up and running again (and still free). CGV is designed to be the place for you to easily find mutual fund capital gains distribution information. If this concept is new to you, have a look at the Articles section of the CGV website where you’ll find educational pieces ranging from beginner concepts to more advanced tax saving strategies.

It’s quite early in the reporting season, but here are some of my initial impressions:

  • Many firms have already posted 2015 estimates. The site already has over 75 firms’ estimates posted so there is already some good information available. This season I’m expecting to post estimates for over 190 fund firms. I’ll continue to cycle through missing firms and update the fund database as new information becomes available. Keep checking in.
  • This year might feel more painful than last year. Based on estimates I’ve found to-date, I’m expecting total distributions to be lower than last year’s numbers. However, if fund performance ends the year near today’s (flat to down) numbers, investors can get a substantial tax bill without accompanying investment gains.
  • It’s already an unusual year. My annual “In the Doghouse” list compiles funds with estimated (or actual) distributions over 20% of NAV. The list will continue to grow as fund firms post information. Already on the list is a fund that distributed over 80%, an index fund and a “tax-managed” fund – oddball stuff!
  • Selling/swapping a distributing fund could save some tax dollars. If you bought almost any fund this year in a taxable account, you should consider selling those shares if the fund is going to have a substantial distribution. (No, fund companies do not want to hear this.) Tax wise, running some quick calculations can help you decide a good strategy. Be careful not to run afoul of the “wash sale” rules.

Of course, the MFO Discussion board (led by TheShadow) puts together its own list of capital gains distribution links. Be sure to check their work out as that list may have some firms that are not included on CGV due to their smaller asset base. Between the two resources, you should be well covered.

I value the input of the MFO community, so if you have any comments to share about CapGainsValet.com, feel free to contact me.

Top developments in fund industry litigation

Fundfox LogoFundfox, launched in 2012, is the mutual fund industry’s only litigation intelligence service, delivering exclusive litigation information and real-time case documents neatly organized, searchable, and filtered as never before. For the complete list of developments last month, and for information and court documents in any case, log in at www.fundfox.com and navigate to Fundfox Insider.

Orders & Decisions

  • A U.S. Magistrate Judge recommended that the court deny First Eagle‘s motion to dismiss fee litigation regarding two of its international equity funds. (Lynn M. Kennis Trust v. First Eagle Inv. Mgmt., LLC)
  • In Jones v. Harris Associates—the fee litigation regarding Oakmark funds in which the U.S. Supreme Court set the legal standard for liability under section 36(b)—the Seventh Circuit denied the plaintiffs’ petition for rehearing en banc in their unsuccessful appeal of the district court’s summary judgment in favor of Harris Associates.
  • J.P. Morgan Investment Management was among six firms named in SEC enforcement actions for short selling violations in advance of stock offerings. J.P. Morgan agreed to pay $1.08 million to settle the charges.
  • Further extending the fund industry’s dismal losing record on motions to dismiss section 36(b) fee litigation, the court denied New York Life‘s motion to dismiss a lawsuit regarding four of its MainStay funds. The court viewed allegations that New York Life delegated “substantially all” of its responsibilities as weighing in favor of the plaintiff’s claim. (Redus-Tarchis v. N.Y. Life Inv. Mgmt., LLC.)
  • After the Tenth Circuit reversed a class certification order in a prospectus disclosure case regarding Oppenheimer‘s California Municipal Bond Fund, the district court reaffirmed the order such that the litigation is once again proceeding as a certified class action. Defendants include independent directors. (In re Cal. Mun. Fund.)
  • Denying Schwab defendants’ petition for certiorari, the U.S. Supreme Court declined to review the controversial Ninth Circuit decision that allowed multiple state common-law claims to proceed with respect to Schwab’s Total Bond Market Fund. Defendants include independent directors. (Northstar Fin. Advisors, Inc. v. Schwab Invs.)
  • In the same lawsuit, the district court partly denied Schwab‘s motion to dismiss, holding (among other things) that defendants had abandoned their SLUSA preclusion arguments with respect to Northstar’s breach of fiduciary duty claims. (Northstar Fin. Advisors, Inc. v. Schwab Invs.)
  • Two UBS advisory firms agreed to pay $17.5 million to settle SEC charges arising from their purported roles in failing to disclose a change in investment strategy by a closed-end fund they advised.
  • By order of the court, the securities fraud class action regarding four Virtus funds transferred from C.D. Cal. to S.D.N.Y. (Youngers v. Virtus Inv. Partners, Inc.)

New Lawsuits

  • Allianz Global Investors and PIMCO are targets of a new ERISA class action that challenges the selection of proprietary mutual funds for the Allianz 401(k) plan. Complaint: “the Fiduciary Defendants treat the Plan as an opportunity to promote the Allianz Family’s mutual fund business and maximize profits at the expense of the Plan and its participants.” (Urakhchin v. Allianz Asset Mgmt. of Am., L.P.)
  • J.P. Morgan is the target of a new section 36(b) excessive fee lawsuit regarding five of its funds. The plaintiffs rely on comparisons to purportedly lower fees that J.P. Morgan charges to other clients. (Campbell Family Trust v. J.P. Morgan Inv. Mgmt., Inc.)
  • Metropolitan West‘s Total Return Bond Fund is the subject of a new section 36(b) excessive fee lawsuit. The plaintiff relies on comparisons to purportedly lower fees that Metroplitan West charges to other clients. (Kennis v. Metro. W. Asset Mgmt., LLC.)

The Alt Perspective: Commentary and news from DailyAlts.

dailyaltsOctober proved to be less than spooky for the equity market as the S&P 500 Index rose 8.44% over the month, leading major asset classes and alternative investment categories. While bonds and commodities were relatively flat, long/short equity funds topped the list of alternative funds and returned an average of 2.88%, while bear market funds shed 11.30% over the month as stocks rallied. Managed futures funds gave back gains they had made earlier in the year with a loss of 1.82% on average, according to Morningstar, while multi-alternative funds posted gains of 1.33%.  All in all, a mixed bag for nearly everything but long-only equity.

Asset Flows

September turned out to be a month when investors decided that it was time to pull money from actively managed mutual funds and ETFs, regardless of asset class, style or strategy – except for alternatives. Every actively managed category, as reported by Morningstar saw outflows other than alternatives, which had net inflows of $719 million to actively managed funds and another $884 million to passively managed alternative mutual funds and ETFs.

As you will recall, volatility started to spike in August when the Chinese devaluated the Yuan, and the turmoil carried into September. But not all alternative categories saw positive inflows in September – in fact few did. Were it not for trading strategy funds, such as inverse funds, the overall alternatives category would be negative:

  • Trading strategies, such as inverse equity funds, added $1.5 billion
  • Multi-alternative funds picked up $998 million
  • Managed futures funds added $744 million
  • Non-traditional bond funds shed $1.3 billion
  • Volatility based funds lost $551 million

New Fund Filings

AlphaCentric and Catalyst both teamed up with third parties to invest in managed futures or related strategies. AlphaCentric partnered with Integrated Managed Futures Corp for a more traditional, single manager managed futures fund while Catalyst is looking to Millburn Ridgefield Corporation to run a managed futures overlay on an equity portfolio – very institutional like!

Another interesting filing was that from a new company called Castlemaine who plans to launch five new alternative mutual funds – all managed by one individual. That’s just hard to do! Hard to criticize that this point, but we will keep an eye on the firm as they come out with new products later this year.

Research

Finally, there were a couple pieces of interesting research that we uncovered this past month, as follows:

Have a wonderful November, and Happy Thanksgiving to all.

Observer Fund Profiles: RNCOX

Each month the Observer provides in-depth profiles of between two and four funds. Our “Most Intriguing New Funds” are funds launched within the past couple years that most frequently feature experienced managers leading innovative newer funds. “Stars in the Shadows” are older funds that have attracted far less attention than they deserve.

RiverNorth Core Opportunity (RNCOX). RiverNorth turns the typical balanced strategy (boring investments, low costs) on its head. At the price of higher pass-through costs, the fund attempts to exploit the occasionally-irrational pricing of the closed-end fund market to add a market-neutral layer of returns to a flexible underlying allocation. That’s work well far more often than it hasn’t.

Launch Alert: T. Rowe Price Emerging Markets Value (PRIJX)

Price launched its Emerging Markets Value fund at the end of September. The manager is Ernest C. Yeung. He started at Price in 2003 as an analyst covering E.M. telecommunication stocks. In 2009 he became a co-manager of the International Small Cap Equity strategy (manifested in the U.S. as Price International Discovery PRIDX), where he was the lead guy on Asian stock selection. Nick Beecroft in Price’s Hong Kong office reports that at the end of 2014, “he began to manage a paper portfolio for the new T. Rowe Price Emerging Markets Value Stock Fund, which he then ran until the fund was launched publicly in September 2015. So Ernest [has] been part of our emerging markets team at T. Rowe for over 12 years.”

The fund will target 50-80 stocks and stock selection will drive both country and sector exposure. Characteristics he’ll look for:

  • low valuation on various earnings, book value, sales, and cash flow metrics, in absolute terms and/or relative to the company’s peers or its own historical norm;
  • low valuation relative to a company’s fundamentals;
  • companies that may benefit from restructuring activity or other turnaround opportunities;
  • a sound balance sheet and other positive financial characteristics;
  • strong or improving position in an overlooked industry or country; and
  • above-average dividend yield and/or the potential to grow dividends.

As Andrew Foster and others have pointed out, value investing has worked poorly in emerging markets. Their argument is that many EM markets, especially Asian ones, have powerful structural impediments to unlocking value. Those include interlocking directorships, control residing in founding families rather than in the corporate management, cross-ownership and a general legal disregard for the rights of minority shareholders. I asked the folks at Price what they thought had changed. Mr. Beecroft replied:

We agree that traditional, fundamental value investing can be challenging in emerging markets. Companies can destroy value for years for all the reasons that you mention. Value traps are prevalent as a result. Our approach deliberately differs from the more traditional fundamental value approach. We take a contrarian approach and actively seek stocks that are out of favour with investors or which have been “forgotten” by the market. We also look for them to have a valuation anchor in the form of a secure dividend yield or book value support. These stocks typically offer attractive valuations and with limited downside risk.

But in emerging markets, just being cheap is not enough. So, we look for a re-rating catalyst. This is where our research team comes in. Re-rating catalysts might be external to the company (e.g., industry structure change, or an improving macro environment) or internal (ROE/ROIC improvement, change in management, improved capital allocation policy, restructuring, etc.). Such change can drive a significant re-rating on the stock.

The emerging markets universe is wide and deep. We are able to find attractive upside potential in stocks that other investors are not always focused on.

The fund currently reports about a quarter million in its portfolio. The initial expense ratio, after waivers, is 1.5%. The minimum initial investment is just $1,000.

Funds in Registration

There are fifteen or so new funds in registration this month. Funds in registration with the SEC are not available for sale to the public and the advisors are not permitted to talk about them, but a careful reading of the filed prospectuses gives you a good idea of what interesting (and occasionally appalling) options are in the pipeline. The funds in registration now have a good chance of launching on December 31, which is critical to allowing them to report full-year results for 2016.

There are some interesting possibilities. Joe Huber is launching a mid-cap fund. ASTON will have an Asia dividend one. And Homestead is launching their International II fund, sub-advised by Harding Loevner.

Manager Changes

Chip tracked down 63 manager changes this month, a fairly typical tally. This month continues the trend of many more women being removed from management teams (9) than added to them (1). There were a few notable changes. The outstanding Boston Partners Long/Short Equity Fund (BPLEX) lost one of its two co-managers. Zac Wydra left Beck Mack & Oliver Partners Fund (BMPEX) to become CIO of First Manhattan Corporation. In an unusual flurry, Kevin Boone left Marsico Capital, then Marsico Capital got booted from the Marsico Growth FDP Fund (MDDDX) that Kevin co-managed, then the fund promptly became the FDP BlackRock Janus Growth Fund.

The Navigator: Fund research fast

compassOne of the coolest resources we offer is also one of the least-used: The Navigator. It’s located on the Resources tab at the top-right of each page. If you enter a fund’s name or ticker symbol in The Navigator, it will instantly search 27 sites for information on the fund:

navigator

If you click on any of those links, it takes you directly to the site’s profile of the fund. (Did you even know The Google had fund pages? They do.)

Updates: INNAX, liquidity debate

four starsIn October we featured Capital Innovations Global Agri, Timber, Infrastructure Fund (INNAX) in our Elevator Talk. Energy-light portfolio, distinctive profile given their focus on “soft” resources like trees and cattle. Substantially above-average performance. They’d just passed their three year anniversary and seven days later they received their inaugural star rating from Morningstar. They’re now recognized as a four star fund within the natural resources group.

We’ve argued frequently that liquidity in the U.S. securities market, famously the most liquid in the world, might be drying up. The translation is: you might not be able to get a fair price for your security if you need to sell at the same time lots of other people are. The SEC is propounding rules to force funds to account for the liquidity of their holdings and to maintain a core of highly-liquid securities that would be sufficient to cover several days’ worth of panicked redemptions. The Wall Street Journal provided a nice snapshot of the potential extent of such problems even in large, conservative fixed-income funds. Using the ability to sell a security within seven days, the article “Bond funds push limits” (9/22/2015) estimates the extent of illiquid assets in five funds:

Vanguard High-Yield Corporate

40%

American Funds American High-Income

39%

Vanguard Long-Term Investment Grade

39%

Dodge & Cox Income

31%

Lord Abbett Short Duration Income

29%

Between them, those funds hold $130 billion. The Investment Company Institute, the industry’s mouthpiece, immediately denounced the story.

It’s not quite The Satanic Verses, but ….

the devils financial dictionary
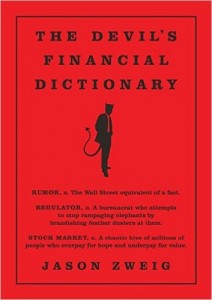
In October, Jason Zweig published his The Devil’s Financial Dictionary. The title, of course, draws from Ambrose Bierce’s classic The Devil’s Dictionary (1906). Critics of Wall Street still nod at entries like “Finance: the art or science of managing revenues or resources for the best advantage of the manager.”

With a combination of wit and a long career during which he incubates both insight and annoyance, Jason wrote what’s become a bedside companion for me. It’s full of short, snippy entries, each of which makes a point that bears making. I think you’d enjoy it, even if you’re the object of it.


Financial Journalist, n. Someone who is an expert at moving words about markets around on a page or screen until they sound impressive, regardless of whether they mean anything. Until the early 20th century, financial journalists knew exactly what they were doing, as many of them were paid overtly or covertly by market manipulators to promote or trash various investments … Nowadays, most financial journalists are honest, which is progress—and ignorant, which isn’t.


Another thing to be thankful for: New data and our impending launch

We’ll be writing to the 6,000 or so of you on our mailing list in the next week or so with updates about our database and other analytics, as well as word of the formal launch of the “MFO premium” site, which will give all of our contributors access to all of this stuff and more.

charles balconyComparing Lipper Ratings

lipper_logo

MFO recently started computing its risk and performance fund metrics and attendant fund ratings using the Lipper Data Feed Service for U.S. Open End funds. (See MFO Switches To Lipper Database.) These new data have now been fully incorporated on the MFO Premium beta site, and on the Great Owl, Fund Alarm, and Dashboard of Profiled Funds pages of our legacy Search Tools. (The Risk Profile and Miraculous Multi-Search pages will be updated shortly).

Last month we noted that the biggest difference MFO readers were likely to find was in the assigned classifications or categories, which are described in detail here. (Morningstar’s categories are described here,  and Lipper nicely compares the two classification methodologies here.) Some examples differences:

  • Lipper uses “Core” instead of “Blend.” So, you will find Large-Cap Growth, Large-Cap Core, and Large Cap Value.
  • Lipper includes a “Multi-Cap” category, in addition to Large-Cap, Medium-Cap, and Small-Cap. “Funds that, by portfolio practice, invest in a variety of market capitalization ranges …” Examples are Vanguard Total Stock Market Index Inv (VTSMX), Auxier Focus Inv (AUXFX), and Bretton (BRTNX).
  • Lipper does not designate an “Asset Allocation” category type, only “Equity” and “Fixed Income.” The traditional asset allocation funds, like James Balanced: Golden Rainbow Retail (GLRBX) and Vanguard Wellesley Income Inv (VWINX) can be found in the categories “Mixed-Asset Target Allocation Moderate” and “Mixed-Asset Target Allocation Conservative,” respectively.
  • Lipper used “Core Bond” instead of say “Intermediate-Term Bond” to categorize funds like Dodge & Cox Income (DODIX).
  • Lipper extends data back to January 1960 versus January 1962. Number of funds still here today that were here in January 1960? Answer: 72, including T Rowe Price Growth Stock (PRGFX).

A few other changes that readers may notice with latest update:

  • Ratings for funds in all the commodities categories, like Commodities Agriculture, where previously we only included “Broad Basket.”
  • Ratings for funds of leveraged and short bias categories, so-called “trading” funds.
  • Ratings for 144 categories versus 96 previously. We continue to not rate money market funds or funds less than 3 months old.
  • No ratings for funds designated as a “variable insurance product,” which typically cannot be purchased directly by investors. Examples are certain Voya, John Hancock, and Hartford funds.
  • There may be a few differences in the so-called “Oldest Share Class (OSC)” funds. MFO has chosen to define OSC as share class with earliest First Public Offering (FPO) date. (If there is a tie, then fund with lowest expense ratio. And, if tied again, then fund with largest assets under management.)

Overall, the changes appear quite satisfactory.

Briefly Noted . . .

Columbia Acorn Emerging Markets (CAGAX) has lifted the cap on what constitutes “small- and mid-sized companies,” their target universe. It has been $5 billion. Effective January 1 their limit bumps to $10 billion. That keeps their investment universe roughly in line with their benchmark’s.

Goldman Sachs Fixed Income Macro Strategies Fund (GAAMX) is making “certain enhancements” to its investment strategies. Effective November 20, 2015, the Fund will use a long/short approach to invest in certain fixed income securities. The trail of the blue line certainly suggests that “certain enhancements” might well be in order.

Goldman Sachs Fixed Income Macro Strategies Fund chart

Here’s something I’ve not read before: “The shareholder of Leland Thomson Reuters Private Equity Index Fund (LDPAX) … approved changing the Fund’s classification from a diversified Fund to a non-diversified Fund under the Investment Company Act of 1940.”

SMALL WINS FOR INVESTORS

Not a lot to cheer for.

CLOSINGS (and related inconveniences)

The closure of the 361 Managed Futures Strategy Fund (AMFQX/ AMFZX) has been delayed “until certain administrative and other implementation matters have been completed.” The plan is to close by December 31, 2015.

The shareholders of Hennessy Cornerstone Large Growth Fund, the Hennessy Cornerstone Value Fund, and the Hennessy Large Value Fund bravely voted to screw themselves by adding 12(b)1 fees to their funds, beginning on November 1, 2015. The Hennessy folks note, in passing, that “This will increase the fees of the Investor Class shares of such Hennessy Funds.”

Invesco European Small Company Fund (ESMAX) will close to new investors on November 30, 2015. By pretty much all measures, it offers access to higher growth rates at lower valuations than the average European stock fund does. The question for most of us is whether such a geographically limited small cap fund ever makes sense. 

Effective after November 13, 2015, the RiverNorth/DoubleLine Strategic Income Fund (RNDLX) is closed to new investors.

OLD WINE, NEW BOTTLES

On December 30, the microscopic and undististinguished Alger Analyst Fund (SPEAX) will become Alger Mid Cap Focus Fund. Usually when a fund highlights Analyst in its name, it’s run by … well, the firm’s analysts. “Research” often signals the same thing. In this case, the fund has been managed since inception by CEO/CIO Dan Chung. After the name change, the fund will be managed by Alex Goldman. 

In one of those “I just want to slap someone” moves, the shareholders of City National Rochdale Socially Responsible Equity Fund (AHRAX) are voting on whether to become the Baywood SociallyResponsible Fund. The insistence of fund firms to turn two words into one word is silly but I could imagine some argument about the ability to trademark a name that’s one word (DoubleLine) that wouldn’t be available if it were two. But mashed-together with the second half officially italicized? Really, guys? The fact that the fund has trailed 97% of its peers over the past decade suggests the need to step back and ask questions more probing than this.

Effective December 31, 2015, Clearbridge Global Growth (LGGAX) becomes ClearBridge International Growth Fund.

Oppenheimer International Small Company Fund (OSMAX) becomes Oppenheimer International Small-Mid Company Fund on December 30, 2015. It’s a very solid fund except for the fact that, at $5.1 billion, is no longer targets small caps: 75% of the portfolio are mid- to large-cap stocks.

On January 11, 2016, the Rothschild U.S. Large-Cap Core Fund, U.S. Large-Cap Value, U.S. Small/Mid-Cap Core, U.S. Small-Cap Core, U.S. Small-Cap Value and U.S. Small-Cap Growth funds will become part of the Pacific Funds Series Trust. Rothschild expects that they’ll continue to manage the year-old funds with Pacific serving as the parent. The new fund names will be simpler than the old and will drop “U.S.”, though the statement of investment strategies retains U.S. as the focus. The funds will be Pacific Funds Large Cap, Large Cap Value, Small/Mid-Cap, Small-Cap, Small-Cap Value and Small-Cap Growth. It appears that the tickers will change.

On December 18, 2015, SSgA Emerging Markets Fund (SSELX) will become State Street Disciplined Emerging Markets Equity Fund, leading mayhap to speculation that it hadn’t been disciplined up until then. The fund will use quant screens “to select a portfolio that the Adviser believes will exhibit low volatility and provide competitive long-term returns relative to the Index.”

As part of a continuing series of fund adoptions, Sound Point Floating Rate Income Fund (SPRFX) will reorganize into the American Beacon Sound Point Floating Rate Income Fund.

Effective October 28, 2015, Victory Fund for Income became Victory INCORE Fund for Income. Presumably because the audience arose, applauding and calling “incore! incore!” Victory Investment Grade Convertible Fund was also rechristened Victory INCORE Investment Grade Convertible Fund.

And, too, Victory renamed all of its recently-acquired Compass EMP funds. The new names will all begin Victory CEMP. So, for example, in testing the hypothesis that no name is too long and obscure to be attractive, Compass EMP Ultra Short-Term Fixed Income Fund (COFAX) will become Victory CEMP Ultra Short Term Fixed Income Fund.

Voya Growth Opportunities Fund changed its name to Voya Large-Cap Growth Fund.

OFF TO THE DUSTBIN OF HISTORY

3D Printing, Robotics and Technology Fund (TDPNX) will liquidate on November 13, 2015. In less than two years, the managers lost 39% for their investors while the average tech fund rose 20%. The Board blamed “market conditions and economic factors” rather than taking responsibility for a fatally-flawed conception. Reaction on the Observer’s discussion board was limited to a single word: “surprised?”

Not to worry, 3D printing fans! The ETF industry has rushed in to fill the (non-existent) gap with the pending launch of the ARK 3D Printing ETF.

Acadian Emerging Markets Debt Fund (AEMDX) has closed and will liquidate on November 20, 2015. It’s a $36 million institutional fund that’s had one good year in five; otherwise, it trailed 70-98% of its peers. Performance seems to have entirely fallen off a cliff in 2015.

AllianzGI NFJ All-Cap Value Fund (PNFAX) is slated for liquidation on December 11, 2015. Their International Managed Volatility (PNIAX) and U.S. Managed Volatility (NGWAX) funds will follow on March 2, 2016. The theory says that managed volatility funds should be competitive with their benchmarks over the long term by limiting losses during downturns. The latter two funds suffered because they couldn’t consistently manage that feat.

Carne Hedged Equity Fund (CRNEX) was a small, decent long/short fund for four years. Then the recent past happened; the fund went from well above average through December 2013 to well below average since. Finally, the last week of October 2015 happened. Here’s the baffling picture:

Carne Hedged Equity Fund chart

Right: 23% loss over four days in a flat market. No word on the cause, though the liquidation filing does refer to a large redemption and anticipated future redemptions. (Ya think?) So now it’s belatedly becoming “a former fund.” Graveside services will be conducted December 30, 2015.

Forward continues … in reverse? To take one step Forward and two back? Forward Global Dividend Fund (FFLRX) will liquidate on November 17th and the liquidation of Forward Select EM Dividend Fund will occur on December 15, 2015. Those appear to be Forward’s fifth and sixth liquidations in 2015, and the fourth since being acquired by Salient this summer.

In order “to optimize the Goldman Sachs Funds and eliminate overlap,” Goldman Sachs has (insightfully) decided to merge Goldman Sachs International Small Cap Fund (GISAX) into Goldman Sachs International Small Cap Insights Fund (GISAX). The target date is February, 2016. That’s a pretty clean win for shareholders. GISAX is, by far, the larger, stronger and cheaper option.

GuideMark® Global Real Return Fund has been liquidated and terminated and, for those of you who haven’t yet gotten the clue, “shares of the Fund are no longer available for purchase or exchange.”

JPMorgan U.S. Research Equity Plus Fund (JEPAX) liquidated after fairly short notice on October 28, 2015. It was a long/short fund of the 130/30 variety: it had a leveraged long position and a short portfolio which together equaled 100% long exposure. That’s an expensive proposition whose success relies on your ability to get three or four things (extent of leverage, target market exposure, long and short security selection) consistently and repeatedly right. Lipper helpfully classifies it as a “Lipper Alternative Active Extension Fund.” It had a few good years rather precisely offset by bad years; in the end, the fund charged a lot (2.32% despite a mystifying Morningstar report of 1.25%), churned the portfolio (178% per year) but provided nothing special (its returns exactly matched the average 100% long large cap fund).

Larkin Point Equity Preservation Fund (LPAUX), a two-year-old long/short fund of funds, will neither preserve or persevere much longer. It has closed and expects to liquidate on November 16, 2015.

On October 16, 2015, Market Vectors got out of the Quality business as they bumped off the MSCI International Quality, MSCI Emerging Markets Quality Dividend, MSCI International Quality Dividend and MSCI Emerging Markets Quality ETFs.

The Board of Trustees of The Royce Fund recently approved the fund reorganizations effective in the first half of 2016. In the first half of 2016, Royce International Premier (RIPN) will eat two of its siblings: European Small Cap (RESNX) and Global Value (RGVIX). Why does it make sense for a $9 million fund with no star rating to absorb its $22 million and $62 million siblings? Of course, Royce is burying a one-star fund that’s trailed 90% of its peers over the past five years. And, too, a one-star fund that’s trailed 100% in the same period. Yikes. Global Value averaged 0.8% annually over the past five years; its average peer pumped out ten times as much.

While they were at it, Royce’s Board of Trustees approved a plan of liquidation for Royce Micro-Cap Discovery Fund (RYDFX), to be effective on December 8, 2015. The $5 million fund is being liquidated “primarily because it has not attracted and maintained assets at a sufficient level for it to be viable.” That suggests that International Micro Cap (ROIMX) with lower returns, two stars and $6 million in assets might be next in line.

Salient MLP Fund (SAMCX) will liquidate on December 1, 2015. Investors will continue to be able to access the management team’s skills through Salient MLP & Energy Infrastructure Fund II (SMAPX) which has over a billion in assets. It’s not a particularly good fund, but it is better than SAMCX.

Schroder Global Multi-Cap Equity Fund (SQQJX) liquidated on October 27, 2015, just days short of its fifth anniversary.

Sirios Focus Fund (SFDIX) underwent “final liquidation” on Halloween, 2015. It’s another fund abandoned after two years of operation.

Tygh Capital Management has recommended the liquidation of its TCM Small-Mid Cap Growth Fund (TCMMX). That will occur just after Thanksgiving.

Touchstone Growth Allocation Fund (TGQAX) is getting absorbed by Touchstone Moderate Growth Allocation Fund (TSMAX) just before Thanksgiving. Both have pretty sad records, but Growth has the sadder of the two. At the same time, Moderate Growth brings in managers Nathan Palmer and Anthony Wicklund from Wilshire Associates. Wilshire replaces Ibbotson Associates (a Morningstar company) as the fund’s advisor. Both are funds-of-mostly-Touchstone funds. After the repositioning, Moderate Growth will offer 40% non-US exposure with 45-75% of its assets in equities. Currently Growth is entirely equities.

UBS Multi-Asset Income Fund (MAIAX) will liquidate on or about December 3, 2015.

The Virtus Disciplined Equity Style (VDEAX), Virtus Disciplined Select Bond (VDBAX) and Virtus Disciplined Select Country (VDCAX) funds will close on November 20th and will liquidate by December 2, 2015. They share about $7 million in assets and a record of consistent underperformance.

Virtus Dynamic Trend Fund (EMNAX) will merge into Virtus Equity Trend Fund (VAPAX), they’re hoping sometime in the first quarter of 2016. I have no idea of why, since EMNAX has $600 million and a better record than VAPAX.

In Closing . . .

In a good year, nearly 40% of our Amazon revenue is generated in November and December. That’s in part because I endlessly nag people about how ridiculously simple, painless and useful it is to bookmark our Amazon link or set it as one of your tabs that opens whenever you start your favorite browser.

Please don’t make me go find some cute nagging-related image to illustrate this point. Just bookmark our Amazon link or set it as an opening tab. That would help so me. Here’s the link http://www.amazon.com/?_encoding=UTF8&tag=mutufundobse-20. Alternatively, you can click on the banner.

A quick tip of the cap to folks who made tax-deductible contributions to the Observer this month: regular subscribers, Greg and Deb; PayPal contributors, Beatrice and David; and those who preferred to mail checks, Marjorie, Tom G. and the folks at Ultimus Fund Solutions. We’re grateful to all of you.

Schwab IMPACT logoThe fund managers I’ve spoken with are nearly unanimous in their loathing of Schwab. Words like “arrogant, high-handed and extortionate” capture the spirit of their remarks. I hadn’t dealt with the folks at Schwab until now, so mostly I nodded sympathetically. I now nod more vigorously.

It’s likely that we’ll be in the vicinity of, but not at, the Schwab IMPACT conference in November. We requested press credentials and were ignored for a good while. Then after poking a couple more times, we were reminded of how rare and precious they were and were asked to submit examples of prior conference coverage. We did, on September 28th. That’s the last we heard from them so we’ll take that as a “we’re Schwab. Go away, little man.” Drop us a note if you’re going to be there and would like to chat at some nearby coffee shop.

We’ll look for you.

David