Category Archives: Stars in the shadows

Small funds of exceptional merit

Pear Tree Polaris Foreign Value Small Cap (QUSOX/QUSIX), February 2015

By David Snowball

Objective and strategy

The managers pursue long-term growth of capital and income by investing in a fairly compact portfolio of international small cap stocks. Their goal is to find the most undervalued streams of sustainable cash flow that they can. The managers start with quantitative screens to establish country and industry rankings, then a second set of valuation screens to identify a pool of potential buys. There are around 17,000 unique companies between $50 million – $3 billion in market cap. Around 400 companies have been passing the screens consistently for the past many months. Portfolio companies are selected after intensive fundamental review. The portfolio typically holds between 75-100 stocks representing at least 10 countries.

Adviser

Pear Tree Advisors is an affiliate of U.S. Boston. U.S. Boston was founded in 1969 to provide wealth management services to high net worth individuals. In 1985, they began to offer retail funds, originally under the Quantitative Funds name, each of which is sub-advised by a respected institutional manager. There are six funds in the family, two domestic (U.S. large cap quality and U.S. small cap) and four international (international multi cap value, international small cap value, and two emerging markets funds). The sub-adviser for this fund is Polaris Capital Management, LLC. Founded in 1995, Polaris describes itself as a “global value equity manager.” The firm is owned by its employees and, as of December 2014, managed $5.6 billion for institutions, retirement plans, insurance companies, foundations, endowments, high-net-worth individuals, investment companies, corporations, pension and profit sharing plans, pooled investment vehicles, charitable organizations, state or municipal governments, and limited partnerships.

Manager

Bernard Horn, Sumanta Biswas and Bin Xiao. Mr. Horn is Polaris’s founder, president, chief investment officer and lead manager on Polaris Global Value Fund. He is, on whole, well-known and well-respected in the industry. Day to day management of the fund, including security selection and position sizing, is handled by Messrs. Biswas and Xiao. Mr. Biswas joined the firm as an intern (2001), was promoted to research analyst (2002), then assistant portfolio manager (2004), vice president (2005) and Partner (2007). Mr. Xiao joined the firm as an analyst in 2006 and was promoted to assistant portfolio manager in 2012. Both are described as investment generalists. The team manages about $5.6 billion together, including the Polaris Global Value Fund (PGVFX) and subadvisory of PearTree Polaris Foreign Value (QFVOX) the value portion of PNC International Equity (PMIEX), and other multi-manager funds.

Strategy capacity and closure

Between $1 – 1.5 billion, an amount that might rise or fall as market conditions change. The number of international small cap stocks is growing, up by nearly 100% in the past decade and the number of international IPOs is growing at ten times the U.S. rate. 

Size constraint is ‘time’ dependent.  The Fund objective is to beat the benchmark with lower than benchmark risk (risk is the ITD annualized beta of the portfolio). The managers’ past experience suggests that a portfolio of around 75-100 stocks provides an acceptable risk/return trade-off. Overlaying a liquidity parameter allowed the Fund to reach the $1- $1.5 billion in potential assets under management. 

However the universe of companies is expanding and liquidity conditions keep changing. Fund managers suggested that they are open to increasing the number of companies in the portfolio as long as the new additions do not compromise their risk/return objective. So, the main constraining factor guiding fund size is how many investable companies the market is offering at any given point in time.  

Active share

“Active share” measures the degree to which a fund’s portfolio differs from the holdings of its benchmark portfolio. High active share indicates management which is providing a portfolio that is substantially different from, and independent of, the index. An active share of zero indicates perfect overlap with the index, 100 indicates perfect independence. The advisor has not calculated the active share for its funds but the managers note that the high tracking error and low correlation with its benchmark implies a high active share.

Management’s stake in the fund

Mr. Horn has over $1 million in the fund and owns about 5% of the fund’s institutional shares. Messrs. Xiao and Biswas each have been $50,000-100,000 invested here; “we have,” they report, “all of our personal investments in our funds.” Three of the four independent trustees have no investment in the fund; one of them has over $100,000.

Opening date

May 1, 2008.

Minimum investment

$2,500, reduced to $1,000 for tax-advantaged accounts. The institutional minimum is $1 million. Roger Vanderlaan, one of the Observer’s readers, reports that the institutional shares of this fund, as well as the two others sub-advised by Polaris for Pear Tree, are all available from Vanguard for a $10,000 initial purchase though they do carry a transaction fee.

Expense ratio

1.04% on assets of $995.3 million for the institutional class shares, 1.41% for investor class shares, as of July 2023. 

Comments

There are three, and only three, great international small cap funds: Wasatch International Opportunities (WAIOX), Grandeur Peak International Opportunities (GPIOX) and Pear Tree Polaris Foreign Value Small Cap.

What do we mean by “small cap”? We looked for funds that invested in (brace yourselves) small and micro-cap stocks. One signal of that is the fund’s average market cap; we targeted funds at $2 billion or less since about 80% of all stocks are below that threshold. Of the 90 funds in the Morningstar’s international small- to mid-cap categories, only 17 actually had portfolios dominated by small cap stocks.

What do we mean by “great”? We started by looking at the returns of those 17 funds over the past one-, three- and five-year periods. Two things were clear: the same names dominated the top four spots over and over and only three funds managed to make money over the past year (through the end of January, 2015). And the fourth fund, Brandes International Small Cap Equity “A”(BISAX) looked strong except (1) it sagged over the past year and (2) the great bulk of its track record, from inception in August 1996 through January 2012, occurred when it was organized as “a private investment commingled fund.” The SEC allowed BISAX to assume the performance record of the prior fund, but questions always arise when an investment vehicle moves from one structure to another.


1 yr

3 yr

5 yr

Risk

Assets ($M)

WAIOX

8.8

15.8

12.5

Average

342

GPIOX

4.3

18.9

Average

775 – closed

QUSOX

5.4

16.8

10.4

Below average

302

BISAX

-2.8

15.5

11.2

n/a

611

(all returns are through January 30, 2015)

That’s leads to two questions: should you consider adding any international small cap exposure to your portfolio? And should you especially consider adding Pear Tree Polaris to it? For many investors, the answer to both is “yes.”

Why international small cap?

There are four reasons to consider adding international small cap exposure.

  1. They are a large opportunity set. About 80% of the world’s stocks have market caps below $2 billion. Grandeur Peak estimates that there are 29,000 investible small cap stocks worldwide, 25,000 being outside of the U.S.
  2. The opportunity set is growing. Since 2000, over 90% of IPOs have been filed outside of the US. Meanwhile, the number of US listed stocks declined from 9,000 to under 5,000 in the first 12 years of the 21stcentury. As markets deepen and the middle class grows in many emerging nations, the number of small caps will continue to climb.
  3. You’re ignoring them, and so is almost everyone else. As we noted above, there are fewer than 20 true international small cap funds. Most of the funds that bear the designation actually invest most of their money into mid-caps and often a lot into large caps as well. According to Morningstar, the average small- to mid-cap international growth fund has 24% of its money in small caps and 19% in large caps. International small value and blend funds invest, on average, 35-38% in small caps. Broad international indexes have only 3-4% of their weightings in small caps, so those won’t help you either. Given that the average individual US investor has an 80% allocation to US stocks, it’s likely that you have under 1% of your portfolio in international small caps.
  4. They are a valuable opportunity set. There are three factors that make them valuable. They are independent: they are weakly correlated with the US market, international large caps or each other, they are rather state-owned and they are driven more by local conditions than by government fiat or global macro trends. They are mispriced. Because of liquidity constraints, they’re ignored by large institutions and index-makers. The average international microcap is covered by one analyst, the average small cap by four, and 20% of international small caps have no analyst coverage. Across standard trailing time periods, they outperform international large caps with higher Sharpe and Sortino ratios. Finally, they are the last, best haven of active management. The average international small cap manager outperforms his or her benchmark by 200-300 bps. Really good ones can add a multiple of that.

Why Pear Tree Polaris?

While this fund is relatively new, the underlying discipline has been in place for 30 years and has been on public display in Polaris Global Value Fund (PGVFX) for 17 years.  The core strategy is disciplined, simple and repeatable. They’re looking to buy the most undervalued companies in the world, based on their calculation of a firm’s sustainable free cash flow discounted by conditions in the firm’s home country. They look, in particular, at free cash flow from operations minus the capital expenditures needed to maintain those operations. By using conservative assumptions about growth and a high discount rate, the system builds a wide margin of safety into its modeling.

The managers overlay those factors with an additional set of risk control in recognition of the fact that individual international small cap stocks are going to be volatile, no matter how compelling the underlying firm’s business model and practices.

Mr. Biswas remembers Mr. Horn’s warning, long ago, that emerging markets stocks are intrinsically volatile. Thinking that he’d found a way around the volatility trap, Biswas targeted a portfolio of defensive essentials, such as rice, fish and textbooks, and then discovered that even “essentials” might plummet 80% one year then rocket 90% the next.

Among the risk management tools they use are position sizing and an attempt to understand what really matters to the firm’s prospects. The normal position size is 1.6% of assets, but they might invest just half of that in a stock with limited liquidity. 

They are typically overweight companies in five sectors: utilities, telecom, healthcare, energy and materials.  The defensive sectors of utilities, telecom and healthcare are only 15% of the 17,000 companies in the small-cap universe. Energy is less than 5% of the same universe.   Materials is adequately represented in the 17,000 company set.  However, finding value opportunities (businesses with stable cash flows with limited down side risk at high discount rates) in these sectors is often challenging. In view of the above, they typically overweight companies in these 5 sectors to ensure greater diversification and lower portfolio volatility.

Because small companies are often monoline, that is they do or make just one thing, their prospects are easier to understand than are those of larger firms, at least once you understand what to pay attention to. Mr. Biswas says that, for many of these firms, you need to understand just three or four key drivers. The other factors, he says, have “low marginal utility.” If you can simplify the firm’s business model, identify the drivers and then learn how to talk with management about them, you can quickly verify a stock’s fundamental attractiveness.

Because those factors change slowly and the portfolio is compact with low turnover (about 10% per year so far, though that might rise over time to the 20-30% range), it’s entirely possible for a small team to track their investible universe.

Bottom Line

This is about the most consistent and most consistently risk-conscious international small cap fund around. It has, since inception, maintained its place among the best funds in its universe and has handily outperformed both the only Gold-rated international small value fund (DFA International Small Value DSIVX) and its average peer by a lot. It has done that while compiling the group’s most attractive risk-return profile. Any fund that invests in such risky assets comes with the potential for substantial losses. That includes this fund. The managers have done an uncommonly good job of anticipating those risks and executing a system that is structurally risk-averse. While they will not always lead the pack, they will – on average and over time – serve their investors well. They deserve a place near the top of the due diligence list for investors interested in risk assets that have not yet run their course.

Fund website

Pear Tree Polaris Foreign Value Small Cap. For those looking for a short introduction to the characteristics of international or global small caps as an asset class, you might consider Chris Tessin’s article “International Small Cap A Missed Opportunity” from Pensions & Investments (2013)

Fact Sheet

(2023)

[cr2015]

RiverPark Large Growth (RPXFX/RPXIX), January 2015

By David Snowball

Objective and strategy

The fund pursues long-term capital appreciation by investing in large cap growth stocks, which it defines generously as those with capitalizations over $5 billion. The manager describes his style as having a “value orientation toward growth.” Their discipline combines a macro-level sensitivity to the effects of powerful and enduring secular changes and on industries which are being disrupted, with intense fundamental research and considerable patience. The fund holds a fair fraction of its portfolio, about 20% at the end of 2014, in mid-cap stocks and has a small lower market cap, lower turnover and more compact portfolio than its peers. Most portfolio positions are weighted at about 2-3% of assets.

Adviser

RiverPark Advisors, LLC. RiverPark was formed in 2009 by former executives of Baron Asset Management. The firm is privately owned, with 84% of the company being owned by its employees. They advise, directly or through the selection of sub-advisers, the seven RiverPark funds. Overall assets under management at the RiverPark funds were over $3.5 billion as of September, 2014.

Manager

Mitch Rubin, a Managing Partner at RiverPark and their CIO. Mr. Rubin came to investing after graduating from Harvard Law and working in the mergers and acquisitions department of a law firm and then the research department of an investment bank. The global perspective taken by the M&A people led to a fascination with investing and, eventually, the opportunity to manage several strategies at Baron Capital. He’s assisted by RiverPark’s CEO, Morty Schaja, and Conrad van Tienhoven, a long-time associate of his. Mitch and his wife are cofounders of The IDEAL School of Manhattan, a small school where gifted kids and those with special needs study and play side-by-side.

Strategy capacity and closure

While Morty Schaja describes capacity and closure plans as “somewhat a comical issue” for a tiny fund, he estimates capacity “to be around $20 billion, subject to refinement if and when we get in the vicinity.” We’ll keep a good thought.

Active share

79.6, as of November 2014. “Active share” measures the degree to which a fund’s portfolio differs from the holdings of its benchmark portfolio. High active share indicates management which is providing a portfolio that is substantially different from, and independent of, the index. An active share of zero indicates perfect overlap with the index, 100 indicates perfect independence. As a rule of thumb, large cap funds with an active share over 70 have legitimately “active” managers while the median for Morningstar’s large cap Gold funds is 76. The active share for RiverPark Large Growth is 79.6, which reflects a high level of independence from its benchmark, the S&P 500 index.

Management’s stake in the fund

Mr. Rubin and Mr. Schaja each have over $1 million invested in the fund. Between them, they own 70% of the fund’s institutional shares. One of the fund’s three trustees has invested between $10,000 and $50,000 in the fund while the other two have not invested in it. As of December 31, 2013, the Trustees and officers of the Trust, as a group, owned 16.27% of the outstanding shares of the fund.

We’d also like to compliment RiverPark for exemplary disclosure: the SEC allows funds to use “over $100,000” as the highest report for trustee ownership. RiverPark instead reports three higher bands: $100,000-500,000, $500,000-1 million, over $1 million. That’s really much more informative than the norm.

Opening date

September 30, 2010.

Minimum investment

The minimum initial investment in the retail class is $1,000 and in the institutional class is $50,000.

Expense ratio

Retail class at 1.23% and institutional class at 0.95% on total assets of $38.3 million, as of July 2023.

Comments

If we had written this profile in January 2014 instead of January 2015, our text could have been short and uncontroversial.  It would read something like:

Mitch Rubin is one of the country’s most experienced growth managers. He’s famously able to follow companies for decades, placing them first in one of the small cap funds he’s run, later in a large cap fund before selling them when they plateau and shorting them as they enter their latter years. With considerable discipline and no emotional investment in any of his holdings, he has achieved outstanding results here and in his earlier charges. From inception through the end of 2013, Large Growth has dramatically outperformed both its large cap growth peer group and the S&P500, and had easily matched or beaten the performance of the top tier of growth funds.  That includes Sequoia (SEQUX), RiverPark Wedgewood (RWGFX), Vanguard PRIMECAP (VPMCX) and the other Primecap funds.

Accurate, true and sort of dull.

Fortunately, 2014 gave us a chance to better understand the fund and Mr. Rubin’s discipline. How so? Put bluntly, the fund’s short-term performance sort of reeked and it managed to reduce a five-star rating down to a three-star one. While it finished 2014 with a modest profit, the fund trailed more than 90% of its large-growth peers. That one year slide then pulled its three-year record from “top 10%” to “just above average.”

The question is: does 2014 represent “early” (as in, the fund moved toward great companies whose discount to fair value kept growing during the year) or “wrong” (that is, making an uninformed, undisciplined or impulsive shift that blew up)? If it’s the former, then 2014’s lag offers reasons to buy the fund while its portfolio is underpriced. If it’s the latter, then it’s time for investors to move on.

Here’s the case that Mitch, Conrad and Morty make for the former.

  • They’re attempting to invest in companies which will grow by at least 20% a year in the future, in hopes of investing in stocks which will return 20% a year for the period we hold them. Since no company can achieve that rate of growth, the key is finding growth that is substantially underpriced.
  • There’s a sort of time arbitrage at work, a claim that’s largely substantiated by a lot of behavioral finance research. Investors generally do not give companies credit for high rates of growth until that growth has been going on for years, at which point they pile in. RiverPark’s goal is to anticipate where next year’s growth is going to be, rather than buying where last year’s growth – or even this year’s growth – was.
  • The proper questions then are (1) is the company’s performance outpacing its stock performance? And, if so, (2) can that performance be sustained? If you answer “yes” to both, then it’s probably time to buy. The mantra was “buy, hold, and, if necessary, double down.”
  • If they’re right, in 2014 they bought a bunch of severely underpriced growth. The firms in the portfolio are growing earnings by about 20% a year and they’re paying a 16x p/e for those stocks. Investors in the large cap universe in general are also paying a 16x p/e, but they’re doing it for stocks that are growing by no more than 7% annually.

Those lower quality firms have risen rapidly, bolstered by low interest rates which have made it cheap for them to buy their way to visibility through financial engineering; debt refinance, for example, might give a one-time boost to shaky earnings while cheap borrowing encourages them to “buy growth” by acquiring smaller firms. Such financial engineering, though, doesn’t provide a basis for long-term growth. For the Large Growth portfolio, they target firms with “fortress-like balance sheets.”

So, they buy great growth companies for cheap. How does that explain the sudden sag in 2014? They point to three factors:

  • Persistently low interest rates: in the short term, they prop up the fortunes of shaking companies, whose stock prices continue to rise as late-arriving investors pile in. In the interim, those rates punish cash-rich financial services firms like Schwab (SCH) and Blackstone Group (BX)
  • Energy repricing: about 13% of the portfolio is focused on energy firms, about twice the category average. Three of their four energy stocks have lost money this year, but are cash-rich with a strong presence in the Marcellus shale region. Globally natural gas sells for 3-4 times more than it does in the US; our prices are suppressed by a lack of transport capacity. As that becomes available, our prices are likely to move toward the global average – and the global average is likely to rise as growth resumes.
  • Anti-corruption contagion: the fund has a lot of exposure to gaming stocks and gaming companies have a lot of exposure to Asian gambling and retail hubs such as Macau. Those are apt to be incredibly profitable long-term investments. The Chinese government has committed to $500 billion in new infrastructure investments to help middle class Chinese reach Macau, and Chinese culture puts great stock in one’s willingness to challenge luck. As a result, Chinese gamblers place far higher wagers than do Western ones, casinos catering to Chinese gamblers have far higher margins (around 50%) than do others and the high-end retailers placed around those casinos rake in about $7,000 per square foot, well more than twice what high-end stores here make. In the short term, though, Prime Minister Xi’s anti-corruption campaign has terrified Chinese high-rollers who are buying and gambling a lot less in hopes of avoiding the attention of crusaders at home. While the long-term profits are driven by the mass market, in the short-term their fate is tied to the cowed high-wealth cohort.

Sooner rather than later, the managers argue, energy prices will rise and firms like Cabot Oil & Gas (COG) will see their stocks soar. Sooner rather than later, the gates of Macau will be opened to hundreds of millions of Chinese vacationers, anxious to challenge luck and buy some bling and stocks like Wynn Resorts (WYNN) will rise dramatically.

This is not a high turnover, momentum strategy designed to capture every market move. Almost all of the apparent portfolio turnover is simply rebalancing within the existing names in order to capture a better risk/return profile. It’s a fairly patient strategy that has, for decades, been willing to tolerate short-term underperformance as the price of long-term outperformance.

Bottom Line

The argument for RiverPark is “that spring is getting compressed tighter and tighter.” That is, a manager with a good track record for identifying great underpriced growth companies and then waiting patiently currently believes he has a bunch of very high quality, very undervalued names in the portfolio. They point to the fact that, for 26 of the 39 firms in the portfolio, the firm’s underlying fundamentals exceeded the market while the stock price in 2014 trailed it. It is clear that the manager is patient enough to endure a flat year or two as the price for long-term success; the fund has, after all, returned an average of 20% a year. The question is, are you?

Fund website

RiverPark Large Growth. Folks interested in hearing directly from Messrs. Rubin and Schaja might listen to our December 2014 conference call with them, which is housed on the Featured Fund page for RiverPark Large Growth.

Fact Sheet

[cr2015]

Polaris Global Value (PGVFX), December 2014

By David Snowball

Objective and strategy

Polaris Global Value attempts to provide above average return by investing in companies with potentially strong sustainable free cash flow or undervalued assets. Their goal is “to invest in the most undervalued companies in the world.” They combine quantitative screens with Graham and Dodd-like fundamental research. The fund is diversified across country, industry and market capitalization. They typically hold 50 to 100 stocks.

Adviser

Polaris Capital Management, LLC. Founded in 1995, Polaris describes itself as a “global value equity manager.” The firm is owned by its employees and, as of September 2014, managed $5 billion for institutions, retirement plans, insurance companies, foundations, endowments, high-net-worth individuals, investment companies, corporations, pension and profit sharing plans, pooled investment vehicles, charitable organizations, state or municipal governments, and limited partnerships. They subadvise four funds include the value portion of the PNC International Equity, a portion of the Russell Global Equity Fund and two Pear Tree Polaris funds.

Manager

Bernard Horn. Mr. Horn is Polaris’s founder, president and senior portfolio manager. Mr. Horn founded Polaris in April 1995 to expand his existing client base dating to the early 1980s. Mr. Horn has been managing Polaris’ global and international portfolios since the firm’s inception and global equity portfolios since 1980. He’s both widely published and widely quoted. He earned a BS from Northeastern University and a MS in Management from MIT. In 2007, MarketWatch named him their Fund Manager of the Year. Mr. Horn is assisted by six investment professionals. They report producing 90% of their research in-house.

Strategy capacity and closure

Substantial. Mr. Horn estimates that they could manage $10 billion firm wide; current assets are at $5 billion across all portfolios and funds.. That decision has already cost him one large client who wanted Mr. Horn to increase capacity by managing larger cap portfolios.

About half of the global value fund’s current portfolio is in small- to mid-cap stocks and, he reports, “it’s a pretty small- to mid-cap world. Something like 80% of the world’s 39,000 publicly traded companies have market caps under $2 billion.” If this strategy reaches its full capacity, they’ll close it though they might subsequently launch a complementary strategy.

Active share

Polaris hasn’t calculated it. It’s apt to be high since, they report “only 51% of the stocks in PGVFX overlap with the benchmark” and the fund’s portfolio is equal-weighted while the index is cap-weighted.

Management’s stake in the fund

Mr. Horn has over $1 million in the fund and owns over 75% of the advisor. Mr. Horn reports that “All my money is invested in the funds that we run. I have no interest in losing my competitive advantage in alpha generation.” In addition, all of the employees of Polaris Capital are invested in the fund.

Opening date

July 31, 1989.

Minimum investment

$2,500, reduced to $2,000 for IRAs. That’s rather modest in comparison to the $75 million minimum for their separate accounts.

Expense ratio

0.99% on $399 million in assets, as of July 2023. The expense ratio was reduced at the end of 2013, in part to accommodate the needs of institutional investors. With the change, PGVFX has an expense ratio in the bottom third of its peer group.

Comments

There’s a lot to like about Polaris Global Value. I’ll list four particulars:

  1. Polaris has had a great century. $10,000 invested in the fund on January 1, 2000 would have grown to $36,600 by the end of November 2014. Its average global stock peer was pathetic by comparison, growing $10,000 to just $16,700. Focus for a minute on the amount added to that initial investment: Polaris added $26,600 to your wealth while the average fund would have added $6,700. That’s a 4:1 difference.
  2. It’s doggedly independent. Its median market cap – $8 billion – is about one-fifth of its peers’. The stocks in its portfolio are all about equally weighted while its peers are much closer to being cap weighted. It has substantially less in Asia and the US (50%) than its peers (70%), offset by a far higher weighting in Europe. Likewise its sector weightings are comparable to its peers in only two of 11 sectors. All of that translates to returns unrelated to its peers: in 1998 it lost 9% while its peers made 24% but it made money in both 2001 and 2002 while its peers lost a third of their money.
  3. It’s driven by alpha, not assets. The marketing for Polaris is modest, the fund is small, and the managers have been content having most of their assets reside in their various sub-advised funds.
  4. It’s tax efficient. Through careful management, the fund hasn’t had a capital gains payout in years; nothing since 2008 at least and Mr. Horn reports a continuing tax loss carry forward to offset still more gains.

The one fly in the ointment was the fund’s performance in the 2007-09 market meltdown. To be blunt, it was horrendous. Between October 2007 and March 2009, Polaris transformed a $10,000 account into a $3,600 account which explains the fund’s excellent tax efficiency in recent years. The drop was so severe that it wiped out all of the gains made in the preceding seven years.

Here’s the visual representation of the fund’s progress since inception.

polaris
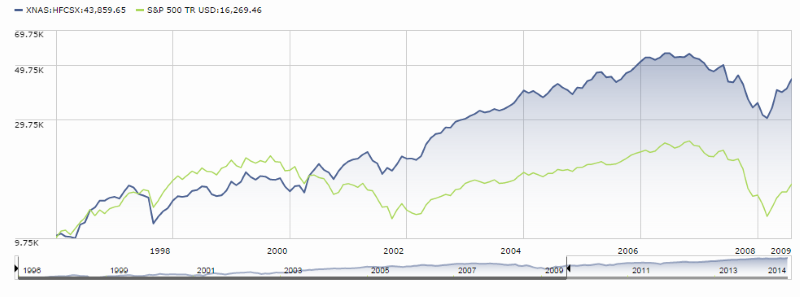
Okay, if that one six quarter period didn’t exist, Polaris would be about the world’s finest fund and Mr. Horn wouldn’t have any explaining to do.

Sadly, that tumble off a cliff does exist and we called Mr. Horn to talk about what happened then and what he’s done about it. Here’s the short version:

“2008 was a bit of an unusual year. The strangest thing is that we had the same kinds of companies we had in the dot.com bubble and were similarly overweight in industrials, materials and banks. The Lehman bankruptcy scared everyone out of the market, you’ll recall that even money market funds froze up, and the panic hit worst in financials and industrials with their high capital demands.”

Like Dodge & Cox, Polaris was buying when prices were at their low point in a generation, only to watch them fall to a three generation low. Their research screens “exploded with values – over a couple thousand stocks passed our initial screens.” Their faith was rewarded with 62% gains over the following two years.

The experience led Mr. Horn and his team to increase the rigor of their screening. They had, for example, been modeling what would happen to a stock if a firm’s growth flat lined. “Our screens are pretty pessimistic; they’re designed to offer very, very conservative financial models of these companies” but 2008 sort of blindsided them. Now they’re modeling ten and twenty percent declines as a sort of stress test. They found about five portfolio companies that failed those tests and which they “kinda got rid of, though they bounced back quite nicely afterward.” In addition they’ve taken the unconventional step of hiring private investigators (“a bunch of former FBI guys”) to help with their due diligence on corporate management, especially when it comes to non-U.S. firms.

He believes that the “soul-searching after 2008” and a bunch of changes in their qualitative approach, in particular greater vigilance for the sorts of low visibility risks occasioned by highly-interconnected markets, has allowed them to fundamentally strengthen their risk management.

As he looks ahead, two factors are shaping his thinking about the portfolio: deflation and China.

On deflation: “We think the developed world is truly in a period of deflation. One thing we learned in investing in Japan for the past 5 plus years, we were able to find companies that were able to raise their operating revenue and free cash flows during what most central bankers would consider the scourge of the economic Earth.” He expects very few industries to be able to raise prices in real terms, so the team is focusing on identifying deflation beating companies. The shared characteristic of those firms is that they’re able to – or they help make it possible for other firms – to lower operating costs by more than the amount revenues will fall. “If you can offer a company product that saves them money – only salvation is lowering cost more dramatically than top line is sinking – you will sell lots.”

On China: “There’s a potential problem in China; we saw lots of half completed buildings with no activity at all, no supplies being delivered, no workers – and we had to ask, why? There are many very, very smart people who are aware of the situation but claim that we’re more worried than we need to be. On whole, Chinese firms seem more sanguine. But no one offers good answers to our concerns.” Mr. Horn thinks that China, along with the U.S. and Japan, are the world’s most attractive markets right now. Still he sees them as a potential source of a black swan event, perhaps arising from the unintended consequences of corruption crackdowns, the government ownership of the entire banking sector or their record gold purchases as they move to make their currency fully convertible on the world market. He’s actively looking for ways to guard against potential surprises from that direction.

Bottom Line

There’s a Latin phrase often misascribed to the 87-year-old titan, Michelangelo: Ancora imparo. It’s reputedly the humble admission by one of history’s greatest intellects that “I am still learning.” After an hour-long conversation with Mr. Horn, that very phrase came to mind. He has a remarkably probing, restless, wide-ranging intellect. He’s thinking about important challenges and articulating awfully sensible responses. The mess in 2008 left him neither dismissive nor defensive. He described and diagnosed the problem in clear, sharp terms and took responsibility (“shame on us”) for not getting ahead of it. He seems to have vigorously pursued strategies that make his portfolio better positioned. It was a conversation that inspired our confidence and it’s a fund that warrants your attention.

Fund website

Polaris Global Value

Fact Sheet

[cr2014]

FPA Paramount (FPRAX), November 2014

By David Snowball

FPA Paramount Fund was reorganized as Phaeacian Global Value Fund.

Objective and Strategy

The FPA Global Value Strategy will seek to provide above-average capital appreciation over the long term while attempting to minimize the risk of capital losses by investing in well-run, financially robust, high-quality businesses around the world, in both developed and emerging markets. The portfolio holds between 25-50 stocks, 33 at present. As of October 2014, the fund’s cash stake was 16.7%.

Adviser

FPA, formerly First Pacific Advisors, which is located in Los Angeles. The firm is entirely owned by its management which, in a singularly cool move, bought FPA from its parent company in 2006 and became independent for the first time in its 50 year history. The firm has 28 investment professionals and 72 employees in total. Currently, FPA manages about $33 billion across five equity strategies and one fixed income strategy. Each strategy is manifested in a mutual fund and in separately managed accounts; for example, the Contrarian Value strategy is manifested in FPA Crescent (FPACX), in nine separate accounts and a half dozen hedge funds. On April 1, 2013, all FPA funds became no-loads.

Managers

Pierre O. Py and Greg Herr. Mr. Py joined FPA in September 2011. Prior to that, he was an International Research Analyst for Harris Associates, adviser to the Oakmark funds, from 2004 to 2010. Mr. Py has managed FPA International Value (FPIVX) since launch. Mr. Herr joined the firm in 2007, after stints at Vontobel Asset Management, Sanford Bernstein and Bankers Trust. He received a BA in Art History at Colgate University. Mr. Herr co-manages FPA Perennial (FPPFX) and the closed-end Source Capital (SOR) funds with the team that used to co-manage FPA Paramount. Py and Herr will be supported by the two research analysts, Jason Dempsey and Victor Liu, who also contribute to FPIVX.

Strategy capacity and closure

Undetermined.

Active share

99.6. “Active share” measures the degree to which a fund’s portfolio differs from the holdings of its benchmark portfolio. High active share indicates management which is providing a portfolio that is substantially different from, and independent of, the index. An active share of zero indicates perfect overlap with the index, 100 indicates perfect independence. The active share for Paramount is 99.6 measured against an MSCI all-world index, which reflects extreme independence.

Management’s Stake in the Fund

At December 31, 2013, by Mr. Herr was between $100,001 and $250,000, and by Mr. Py was still $0 after two years as manager. Mr. Py did have a very large investment in his other charge, FPA International Value. Three of the five independent trustees had between $10,000 and $50,000 invested in the fund, a fourth trustee had over $100,000 and the final trustee was relatively new to the organization and had no investment in the fund.

Opening date

September 8, 1958.

Minimum investment

$1,500, reduced to $100 for IRAs or accounts with automatic investing plans.

Expense ratio

1.26% on $304 million in assets, as of October, 2014. That is 32 basis points higher than it was a year earlier. Mr. Herr explained that the fund’s board of trustees and shareholders approved a higher management fee; global funds typically charge more than domestic ones in recognition of the fact that such portfolios are costlier to assemble and maintain. The fund remains less expensive than its peers.

Comments

Until September 2013, FPA Paramount and FPA Perennial (FPPFX) were essentially clones of one another. High quality clones, but clones nonetheless. FPA has decided to change that. Beginning in 2011, they began to transition-in a new management team by adding Messrs Herr and Py to the long-tenured team of Stephen Geist and Eric Ende. In September 2013, Messrs Geist and Ende focused all of their efforts on Perennial while Herr and Py have sole charge of Paramount.

That same month, the fund shifted its principal investment strategies to more closely mirror the approach taken in FPA International Value (FPIVX). Ende and Geist stayed fully invested in high-quality domestic small and mid-cap stocks. Herr and Py pursued a global, absolute value strategy. That shift shows up in three ways:

  1. The market cap has climbed. Paramount’s market cap is about four times higher than it was a year ago.
  2. The global exposure has climbed. They’ve shifted from about 10% non-US to about 50%.
  3. The cash stash has climbed. Ende and Geist generally held frictional cash, 3-4% or so. Herr and Py have nearly 17%. At base, an absolute value discipline holds that you should not put money into risky assets unless you’re being more than compensated for those risks. If valuations are high, future returns are iffy and the party’s roaring on, absolute value investors hold cash and wait.

Sadly, the performance has not climbed. Between the date of the strategy transition and October 30, 2014, a $10,000 investment in Paramount would have grown to $10,035. The average global stock fund would have provided $11,670. The fund had been modestly trailing its peers until the 3rd quarter of 2014, when it dropped 9% compared to a modest 3.3% loss for its peers.

Manager Greg Herr and I talked about the fund’s performance in late October, 2014. He attributed the fund’s modest lag through the beginning of July to three factors:

  1. A small drag from unhedged foreign currency exposure, primarily the euro and pound.
  2. A more substantial drag from the fund’s largest cash stake.
  3. The inevitable lag of a value-oriented portfolio in a growth-oriented period.

The more substantial lag from July to the present seems largely driven by the fund’s hidden emerging markets exposure, and particularly exposure to the EM consumer. The fund added five new positions in the second quarter of 2014 (Adidas, ALS Limited, Hypermarcas SA, Prada TNT Express) which have significant EM exposure. Adidas, for example, is the world’s largest provider of golf equipment and supplies; it has consciously expanded into the emerging markets, including adding 850 outlets in Russia. Oops. Prada is the brand of choice for Chinese consumers looking to express their appreciation to local elected officials, a category that’s been dampened by an anti-corruption initiative. Hypermarcas is a Brazilian retailer selling global brands (Johnson & Johnson products, for example) into a market destabilized by economic and political uncertainty ahead of recent presidential elections.

The largest hit came from their stake in Fugro, a Dutch oil services company that does a lot of the geoscience stuff for exploration and production companies. The stock dropped 40% in July on profit warnings, driven by a combination of a deterioration in the oil & gas exploration business and in some “company-specific issues.” David Herro, who managers Oakmark International and who also owns a lot of Fugro, remains “a firm shareholder” because he thinks Fugro has great potential.

Herr and Py agree. They continue to monitor their holdings, but believe that the portfolio is now deeply undervalued which means it’s also positioned to produce abnormally high returns. They’ve continued adding to some of these positions as the value deepened. In addition, the market instability in the third quarter is beginning to drive the price of some strong businesses – perhaps five or six are “near the door” – low enough to provide potential near-term uses for the fund’s large cash reserve.

Bottom Line

It’s hard being independent and this is a very independent fund. When a member of the investment herd is out-of-step with the rest of the herd, it’s likely to be only marginally and almost invisible so. It remains safely masked by mediocrity. When a highly independent fund is out-of-step, it’s really visible and can cause considerable shareholder anxiety. That said, the question is whether you’re better served by understanding and reacting to the distinctive tactics of an absolute value portfolio or by reacting to a single striking quarter. The latter is certainly the common response, which almost surely means it’s the wrong one. That said, FPA’s recent and substantial fee increase has raised the bar for Paramount’s managers and have disadvantaged its shareholders. The fund is intriguing but the business decision is regrettable.

Fund website

FPA Paramount Fund

[cr2014]

Matthews Asia Total Return Bond (formerly Matthews Asia Strategic Income), (MAINX), September 2014

By David Snowball

At the time of publication, this fund was named Matthews Asia Strategic Income.

We’ve published several profiles of MAINX.  for background, our February 2013 profile is here.

*Matthews Asia liquidated their two fixed-income funds in March, 2023. In consequence, the information for Marathon Value should be read for archival purposes only.*

Objective and Strategy

MAINX seeks total return over the long term with an emphasis on income. The fund invests in income-producing securities including, but not limited to, debt and debt-related instruments issued by government, quasi-governmental and corporate bonds, dividend-paying stocks and convertible securities (a sort of stock/bond hybrid). The fund may hedge its currency exposure, but does not intend to do so routinely. In general, at least half of the portfolio will be in investment-grade bonds. Equities, both common stocks and convertibles, will not exceed 20% of the portfolio.

Adviser

Matthews International Capital Management. Matthews was founded in 1991 and advises the 15 Matthews Asia funds. As of July 31, 2014, Matthews had $27.3 billion in assets under management. On whole, the Matthews Asia funds offer below average expenses. They also publish an interesting and well-written newsletter on Asian investing, Asia Insight.

Manager(s)

Teresa Kong is the lead manager. Before joining Matthews in 2010, she was Head of Emerging Market Investments at Barclays Global Investors (now BlackRock) and responsible for managing the firm’s investment strategies in Emerging Asia, Eastern Europe, Africa and Latin America. In addition to founding the Fixed Income Emerging Markets Group at BlackRock, she was also Senior Portfolio Manager and Credit Strategist on the Fixed Income credit team. She’s also served as an analyst for Oppenheimer Funds and JP Morgan Securities, where she worked in the Structured Products Group and Latin America Capital Markets Group. Kong has two co-managers, Gerald Hwang and Satya Patel. Mr. Hwang for three years managed foreign exchange and fixed income assets for some of Vanguard’s exchange-traded funds and mutual funds before joining Matthews in 2011. Mr. Patel worked more in the hedge fund and private investments universe.

Strategy capacity and closure

“We are,” Ms. Kong notes, “a long way from needing to worry about that.” She notes that Matthews has a long record of moving to close their funds when asset flows and market conditions begin to concern the manager. Both the $8 billion Pacific Tiger (MAPTX) and $5.4 billion Asia Dividend (MAPIX) funds are currently closed.

Management’s Stake in the Fund

As of the April 2014 Statement of Additional Information, Ms. Kong had between $100,000 and 500,000 invested in the fund, as well as substantial investments in seven other Matthews funds.  There’s no investment listed for her co-managers. In addition, two of the fund’s five trustees have invested in it: Geoffrey Bobroff has between $10,000 – 50,000 and Mr. Matthews has over $100,000.

Opening date

November 30, 2011.

Minimum investment

$2500 for regular accounts, $500 for IRAs for the retail shares. The fund’s available, NTF, through most major supermarkets.

Expense ratio

1.10%, after waivers, on $66 million in assets (as of August, 2014). There’s also a 2% redemption fee for shares held fewer than 90 days. The Institutional share class (MINCX) charges 0.90% and has a $3 million minimum.

Comments

If I spoke French, I’d probably shrug eloquently, gesture broadly with an impish Beaujolais and declare “plus ça change, plus c’est la même chose.” (Credit Jean-Baptiste Alphonse Karr, 1849.)

After four conversations with Teresa Kong, spread out over three years, it’s clear that three fundamental things remain unchanged:

  1. Asia remains a powerful and underutilized source of income for many investors. The fundamentals of their fixed-income market are stronger than those in Europe or the U.S. and most investors are systematically underexposed to the Asian market. That underexposure is driven by a quirk of the indexes and of all of the advisors who benchmark against them. Fixed income indexes are generally debt-weighted, that is, they give the greatest weight to the most heavily indebted issuers. Since few of those issuers are domiciled in Asia, most investors have very light exposure to a very dynamic region.
  2. Matthews remains the firm best positioned to help manage your exposure there. The firm has the broadest array of funds, longest history and deepest analyst core dedicated to Asia of any firm in the industry.
  3. MAINX remains a splendid tool for gaining that exposure. MAINX has the ability to invest across a wide array of income-producing securities, including corporate (61% of the portfolio, as of August 2014) and government (22%) bonds, convertibles (9%), equities (5%) and other assets. It has the freedom to hedge its currency exposure and to change duration in response to interest rate shifts. The fund’s risk and return profile maximum drawdown continues to track the firm’s expectations which is good given the number of developments which they couldn’t have plausibly predicted before launch. Ms. Kong reports that “the maximum drawdown over one- and three- months was -4.41% and -5.84%, which occurred in June and May-July 2013, respectively. This occurred during the taper tantrum and is fully in-line with our back-tests. From inception to July 2014, the strategy has produced an annualized return of 6.63% and a Sharpe ratio of 1.12 since inception, fully consistent with our long-term return and volatility expectations.”

The fund lacks a really meaningful Morningstar peer group and has few competitors. That said, it has substantially outperformed its World Bond peer group (the orange line), Aberdeen Asian Bond (AEEAX, yellow) and Wisdom Tree Asia Local Debt ETF (ALD, green).

mainx

In our August 2014 conversation, Ms. Kong made three other points which are relevant for folks considering their options.

  1. the US is being irreversibly marginalized in global financial markets which is what you should be paying attention to. She’s neither bemoaning nor celebrating this observation, she’s just making it. At base, a number of conditions led to the US dollar becoming the world’s hegemonic currency which was reinforced by the Saudi’s decision in the early 1970s to price oil only in US dollars and to US investment flows driving global liquidity. Those conditions are changing but the changes don’t seem to warrant the attention of editors and headline writers because they are so slow and constant. Among the changes is the rise of the renminbi, now the world’s #2 currency ahead of the euro, as a transaction currency, the creation of alternative structures to the IMF which are not dollar-linked or US driven and a frustration with the US regulatory system (highlighted by the $9B fine against BNP Paribas) that’s leading international investors to create bilateral agreements that allow them to entirely skirt us. The end result is that the dollar is likely to be a major currency and perhaps even the dominant currency, but investors will increasingly have the option of working outside of the US-dominated system.
  2. the rising number of “non-rated” bonds is not a reflection on credit quality: the simple fact is that Asian corporations don’t need American money to have their bond offerings fully covered and they certainly don’t need to expense and hassle of US registration, regulation and paying for (compromised) US bond rating firms to rate them. In lieu of US bond ratings, there are Asia bond-rating firms (whose work is not reflecting in Morningstar credit reports) and Matthews does extensive internal research. The depth of the equity-side analyst corps is such that they’re able “to tear apart corporate financials” in a way that few US investors can match.
  3. India is fundamentally more attractive than China, at least for a fixed-income investor. Most investors enthused about India focus on its new prime minister’s reform agenda. Ms. Kong argues that, by far, the more significant player is the head of India’s central bank, who has been in office for about a year. The governor is intent on reducing inflation and is much more willing to deploy the central bank’s assets to help stabilize markets. Right now corporate bonds in India yield about 10% – not “high yield” bond but bonds from blue chip firms – which reflects a huge risk premium. If inflation expectations change downward and inflation falls rather than rises, there’s a substantial interest rate gain to be harvested there. The Chinese currency, meanwhile, is apt to undergo a period of heightened volatility as it moves toward a free float; that is, an exchange rate set by markets rather than by Communist Party dictate. She believes that that volatility is not yet priced in to renminbi-denominated transactions. Her faith is such that the fund has its second greatest currency exposure to the rupee, behind only the dollar.

Bottom Line

MAINX offers rare and sensible access to an important, under-followed asset class. The long track record of Matthews Asia funds suggests that this is going to be a solid, risk-conscious and rewarding vehicle for gaining access to that class. The fund remains small though that will change. It will post a three-year record in November 2014 and earn a Morningstar rating by year’s end; the chart above hints at the possibility of a four- or five-star rating. Ms. Kong also believes that it’s going to take time for advisors get “more comfortable with Asia Fixed Income as an asset class. It took a decade or so for emerging markets to become more widely adopted and we expect that Asia fixed income will become more ubiquitous as investors gain comfort with Asia as a distinct asset class.” You might want to consider arriving ahead of the crowd. 

Disclosure: while the Observer has no financial or other ties to Matthews Asia or its funds, I do own shares of MAINX in my personal account and have recently added to them.

Fund website

Matthews Asia Strategic Income homepage and Factsheet. There’s a link to a very clear discussion of the fund’s genesis and strategy in a linked document, entitled Matthews Q&A.  It’s worth your time.

[cr2014]


Akre Focus (AKREX), September 2014

By David Snowball

Objective

The fund seeks long-term capital appreciation by investing, mostly, in US stocks of various sizes and in “other equity-like instruments.”  The manager looks for companies with good management teams (those with “a history of treating public shareholders like partners”), little reliance on debt markets and above-average returns on equity. Once they find such companies, they wait until the stock sells at a discount to “a conservative estimate of the company’s intrinsic value.” The Fund is non-diversified, with both a compact portfolio (30 or so names) and a willingness to put a lot of money (often three or four times more than a “neutral weighting” would suggest) in a few sectors.

Adviser

Akre Capital Management, LLC, an independent Registered Investment Advisor located in Middleburg, VA. Mr. Akre, the founder of the firm, has been managing portfolios since 1986. As of June 30, 2014, ACM had approximately $3.8 billion in client assets under management, split between Akre Capital Management, which handles the firm’s separately managed accounts ($1 million minimum), a couple hedge funds, and Akre Focus Fund.  

Managers

John Neff and Chris Cerrone. 

Mr. Neff is a Partner at Akre Capital Management and has served as portfolio manager of the fund since August 2014, initially with founder Chuck Akre. Before joining Akre, he served for 10 years as an equity analyst at William Blair & Company. Mr. Cerrone is a Partner at Akre Capital Management and has served as portfolio manager of the fund since January 2020. Before that he served as an equity analyst for Goldman Sachs for two years.

Strategy capacity and closure

Mr. Akre allows that there “might be” a strategy limit. The problem, he reports, is that “Every time I answer that question, I’ve been proven to be incorrect.  In 1986, I was running my private partnership and, if you’d asked me then, I would have said ‘a couple hundred million, tops.’”  As is, he and his team are “consumed with producing outcomes that are above average.  If no opportunities to do that, we will close the fund.”

Active share

96. “Active share” measures the degree to which a fund’s portfolio differs from the holdings of its benchmark portfolio. High active share indicates management which is providing a portfolio that is substantially different from, and independent of, the index. An active share of zero indicates perfect overlap with the index, 100 indicates perfect independence. The active share for the Akre Focus Fund is 96, which reflects a very high level of independence from its benchmark S&P 500.

Management’s Stake in the Fund

Mr. Neff and Mr. Cerrone have each invested over $1 million of their own money in Akre Focus.

Opening date

August 31, 2009 though the FBR Focus fund, which Mr. Akre managed in the same style, launched on December 31, 1996.

Minimum investment

$2,000 for regular accounts, $1000 for IRAs and accounts set up with automatic investing plans. The fund also has an institutional share (AKRIX) class with a $250,000 minimum.

Expense ratio

1.3% on assets of about $4.2 billion, as of June 2023. There’s also a 1.00% redemption fee on shares held less than 30 days. The institutional share class on assets of about $7.2 billion has an expense ratio of 1.04% with the difference being the absence of a 12(b)1 fee. 

Comments

In 1997, Mr. Akre became of founding manager of FBR Small Cap Growth – Value fund, which became FBR Small Cap Value, then FBR Small Cap, and finally FBR Focus (FBRVX). Across the years and despite many names, he applied the same investment strategy that now drives Akre Focus. Here’s his description of the process:

  1. We look for companies with a history of above average return on owner’s capital and, in our assessment, the ability to continue delivering above average returns going forward.

    Investors who want returns that are better than average need to invest in businesses that are better than average. This is the pond we seek to fish in.

  2. We insist on investing only with firms whose management has demonstrated an acute focus on acting in the best interest of all shareholders.

    Managers must demonstrate expertise in managing the business through various economic conditions, and we evaluate what they do, say and write for demonstrations of integrity and acting in the interest of shareholders.

  3. We strive to find businesses that, through the nature of the business or skill of the manager, present clear opportunities for reinvestment in the business that will deliver above average returns on those investments.

    Whether looking at competitors, suppliers, industry specialists or management, we assess the future prospects for business growth and seek out firms that have clear paths to continued success.

The final stage of our investment selection process is to apply a valuation overlay…

Mr. Akre’s discipline leads to four distinguishing characteristics of his fund’s portfolio:

  1. It tends to have a lot of exposure to smaller cap stocks. His explanation of that bias is straightforward: “that’s where the growth is.”
  2. It tends to make concentrated bets. He’s had as much as a third of the portfolio in just two industries (gaming and entertainment) and his sector weightings are dramatically different from those of his peers or the S&P500. 
  3. It tends to stick with its investments. Having chosen carefully, Mr. Akre tends to wait patiently for an investment to pay off. In the past 15 years his turnover rate never exceeded 25% and is sometimes in the single digits.
  4. It tends to have huge cash reserves when the market is making Mr. Akre queasy. From 2001 – 04, FBRVX’s portfolio averaged 33.5% cash – and crushed the competition. It was in the top 2% of its peer group in three of those four years and well above average in the fourth year. At the end of 2009, AKREX was 65% in cash. By the end of 2010, it was still over 20% in cash. 

It’s been a very long time since anyone seriously wondered whether investing with Mr. Akre was a good idea. As a quick snapshot, here’s his record (blue) versus the S&P500 (green) from 1996 – 2009:

akrex1

And again from 2009 – 2014:

akrex2

Same pattern: while the fund lags the market from time to time – for as long as 18-24 months on these charts – it beats the market by wide margins in the long term and does so with muted volatility. Over the past three to five years AKREX has, by Morningstar’s calculation, captured only about half of the market’s downside and 80-90% of its upside.

There are two questions going forward: does the firm have a plausible succession plan and can the strategy accommodate its steadily growing asset base? The answers appear to be: yes and so far.

Messrs. Saberhagen and Neff have been promoted from “analyst” to “manager,” which Mr. Akre says just recognizes the responsibilities they’d already been entrusted with. While they were hired as analysts, one from a deep value shop and one from a growth shop, “their role has evolved over the five years. We operate as a group. Each member of the group is valued for their contributions to idea generation, position sizing and so on.” There are, on whole, “very modest distinctions” between the roles played by the three team members. Saberhagen and Neff can, on their own initiative, change the weights of stocks in the portfolio, though adding a new name or closing out a position remains Mr. Akre’s call. He describes himself as “first among equals” and spends a fair amount of his time trying to “minimize the distractions for the others” so they can focus on portfolio management. 

The continued success of his former fund, now called Hennessy Focus (HFCSX) and still managed by guys he trained, adds to the confidence one might have in the ultimate success of a post-Akre fund.

The stickier issue might be the fund’s considerable girth. Mr. Akre started as a small cap manager and much of his historic success was driven by his ability to ferret out excellent small cap growth names. A $3.3 billion portfolio concentrated in 30 names simply can’t afford to look at small cap names. He agrees that “at our size, small businesses can’t have a big impact.” Currently only about 3% of the portfolio is invested in four small cap stocks that he bought two to three years ago. 

Mr. Akre was, in our conversation, both slightly nostalgic and utterly pragmatic. He recalled cases where he made killings on an undervalued subprime lender or American Tower when it was selling for under $1 a share. It’s now trading near $100. But, “those can’t move the needle and so we’re finding mid and mid-to-large cap names that meet our criteria.” The portfolio is almost evenly split between mid-cap and large cap stocks and sits just at the border between a mid-cap and large cap designation in Morningstar’s system. So far, that’s working.

Bottom Line

This has been a remarkable fund, providing investors with a very reliable “win by not losing” machine that’s been compounding returns for decades. Mr. Akre remains in control and excited and is backed by a strong next generation of leadership. In an increasingly pricey market, it certainly warrants a sensible equity investor’s close attention.

Fund website

Akre Focus Fund

[cr2014]

Guinness Atkinson Global Innovators (IWIRX), August 2014

By David Snowball

Objective and strategy

The fund seeks long term capital growth through investing in what they deem to be 30 of the world’s most innovative companies. They take an eclectic approach to identifying global innovators. They read widely (for example Fast Company and MIT’s Technology Review, as well as reports from the Boston Consulting Group and Thomson Reuters) and maintain ongoing conversations with folks in a variety of industries. At base, though, the list of truly innovative firms seems finite and relatively stable. Having identified a potential addition to the portfolio, they also have to convince themselves that it has more upside than anyone currently in the portfolio (since there’s a one-in-one-out discipline) and that it’s selling at a substantial discount to fair value (typically about one standard deviation below its 10 year average). They rebalance about quarterly to maintain roughly equally weighted positions in all thirty, but the rebalance is not purely mechanical. They try to keep the weights “reasonably in line” but are aware of the importance of minimizing trading costs and tax burdens. The fund stays fully invested.

Adviser

Guinness Atkinson Asset Management. The firm started in 1993 as the US arm of Guinness Flight Global Asset Management and their first American funds were Guinness Flight China and Hong Kong (1994) and Asia Focus(1996). Guinness Flight was acquired by Investec, then Tim Guinness and Jim Atkinson acquired Investec’s US funds business to form Guinness Atkinson. Their London-based sister company is Guinness Asset Management which runs European funds that parallel the U.S. ones. The U.S. operation has about $460 million in assets under management and advises the eight GA funds.

Manager

Matthew Page and Ian Mortimer. Mr. Page joined GA in 2005 after working for Goldman Sachs. He earned an M.A. from Oxford in 2004. Dr. Mortimer joined GA in 2006 and also co-manages the Global Innovators (IWIRX) fund. Prior to joining GA, he completed a doctorate in experimental physics at the University of Oxford. The guys also co-manage the Inflation-Managed Dividend Fund (GAINX) and its Dublin-based doppelganger Guinness Global Equity Income Fund.

Strategy capacity and closure

Approximately $1-2 billion. After years of running a $50 million portfolio, the managers admit that they haven’t had much occasion to consider how much money is too much or when they’ll start turning away investors. The current estimate of strategy capacity was generated by a simple calculation: 30 times the amount they might legally and prudently own of the smallest stock in their universe.

Active share

96. “Active share” measures the degree to which a fund’s portfolio differs from the holdings of its benchmark portfolio. High active share indicates management which is providing a portfolio that is substantially different from, and independent of, the index. An active share of zero indicates perfect overlap with the index, 100 indicates perfect independence. The active share for Global Innovators is 96, which reflects a very high level of independence from its benchmark MSCI World Index.

Management’s stake in the fund

The managers are not invested in the fund because it’s only open to U.S. residents.

Opening date

Good question! The fund launched as the Wired 40 Index on December 15, 1998. It performed splendidly. It became the actively managed Global Innovators Fund on April 1, 2003 under the direction of Edmund Harriss and Tim Guinness. It performed splendidly. The current team came onboard in May 2010 (Page) and May 2011 (Mortimer) and tweaked the process, after which it again performed splendidly.

Minimum investment

$5,000, reduced to $1,000 for IRAs and just $250 for accounts established with an automatic investment plan.

Expense ratio

1.45% on assets of about $100 million, as of August 1, 2014. The fund has been drawing about $500,000/day in new investments this year.  

Comments

Let’s start with the obvious and work backward from there.

The obvious: Global Innovators has outstanding (consistently outstanding, enduringly outstanding) returns. The hallmark is Lipper’s recognition of the fund’s rank within its Global Large Cap Growth group:

One year rank

#1 of 98 funds, as of 06/30/14

Three year rank

#1 of 72

Five year rank

#1 of 69

Ten year rank

#1 of 38

Morningstar, using a different peer group, places it in the top 1 – 6% of US Large Blend funds for the past 1, 3, 5 and 10 year periods (as of 07/31/14). Over the past decade, a $10,000 initial investment would have tripled in value here while merely doubling in value in its average peer.

But why?

Good academic research, stretching back more than a decade, shows that firms with a strong commitment to ongoing innovation outperform the market. Firms with a minimal commitment to innovation trail the market, at least over longer periods. 

The challenge is finding such firms and resisting the temptation to overpay for them. The fund initially (1998-2003) tracked an index of 40 stocks chosen by the editors of Wired magazine “to mirror the arc of the new economy as it emerges from the heart of the late industrial age.” In 2003, Guinness concluded that a more focused portfolio and more active selection process would do better, and they were right. In 2010, the new team inherited the fund. They maintained its historic philosophy and construction but broadened its investable universe. Ten years ago there were only about 80 stocks that qualified for consideration; today it’s closer to 350 than their “slightly more robust identification process” has them track. 

This is not a collection of “story stocks.” The managers note that whenever they travel to meet potential US investors, the first thing they hear is “Oh, you’re going to buy Facebook and Twitter.” (That would be “no” to both.) They look for firms that are continually reinventing themselves and looking for better ways to address the opportunities and challenges in their industry. While that might describe eBay, it might also describe a major petroleum firm (BP) or a firm that supplies backup power to data centers (Schneider Electric). The key is to find firms which will produce disproportionately high returns on invested capital in the decade ahead, not stocks that everyone is talking about.

Then they need to avoid overpaying for them. The managers note that many of their potential acquisitions sell at “extortionate valuations.” Their strategy is to wait the required 12 – 36 months until they finally disappoint the crowd’s manic expectations. There’s a stampede for the door, the stocks overshoot – sometimes dramatically – on the downside and the guys move in.

Their purchases are conditioned by two criteria. First, they look for valuations at least one standard deviation below a firm’s ten year average (which is to say, they wait for a margin of safety). Second, they maintain a one-in-one-out discipline. For any firm to enter the portfolio, they have to be willing to entirely eliminate their position in another stock. They turn the portfolio over about once every three years. They continue tracking the stocks they sell since they remain potential re-entrants to the portfolio. They note that “The switches to the portfolio over the past 3.5 – 4 years have, on average, done well. The additions have outperformed the dropped stocks, on a sales basis, by about 25% per stock.”

Bottom Line

While we need to mechanically and truthfully repeat the “past performance is not indicative of future results” mantra, Global Innovator’s premise and record might give us some pause. Its strategy is grounded in a serious and sustained line of academic research. Its discipline is pursued by few others. Its results have been consistent across 15 years and three sets of managers. For investors willing to tolerate the slightly-elevated volatility of a fully invested, modestly pricey equity portfolio, Global Innovators really does command careful attention.

Fund website

GA Global Innovators Fund. While you’re there, please do read the Innovation Matters (2014) whitepaper. It’s short, clear and does a nice job of walking you through both the academic research and the managers’ approach.

[cr2014]

RiverNorth/Oaktree High Income (RNOTX/RNHIX) – June 2014

By David Snowball

Objective and strategy

The fund tries to provide total return, rather than just income. The strategy is to divide the portfolio between two distinctive strategies. Oaktree Capital Management pursues a “barbell-shaped” strategy consisting of senior bank loans and high-yield debt. RiverNorth Capital Management pursues an opportunistic closed-end fund (CEF) strategy in which they buy income-producing CEFs when those funds are (1) in an attractive sector and (2) are selling at what the manager’s research estimates to be an unsustainable discount to NAV. In theory, the entire portfolio might be allocated to any one of the three strategies; in practice, RiverNorth anticipates a “neutral position” in which 25 – 33% of the portfolio is invested in CEFs.

Adviser

RiverNorth Capital Management. RiverNorth is a Chicago-based firm, founded in 2000 with a distinctive focus on closed-end fund arbitrage. They have since expanded their competence into other “under-followed, niche markets where the potential to exploit inefficiencies is greatest.” RiverNorth advises the five RiverNorth funds: Core (RNCOX, closed), Managed Volatility (RNBWX), Equity Opportunity (RNEOX), RiverNorth/DoubleLine Strategic Income (RNDLX) and this one. They manage about $1.9 billion through limited partnerships, mutual funds and employee benefit plans.

Manager

Patrick Galley and Stephen O’Neill of RiverNorth plus Desmund Shirazi, Sheldon M. Stone and Shannon Ward of Oaktree. Mr. Galley is RiverNorth’s founder, president and chief investment officer; Mr. O’Neill is the chief trader, a remarkably important position in a firm that makes arbitrage gains from trading on CEF discounts. Mr. Shirazi is one of Oaktree’s senior loan portfolio managers, former head of high-yield research and long-ago manager of TCW High Yield Bond. Ms. Ward, who joined this management team just a year ago, was a vice president for high-yield investments at AIG back when they were still identified with The Force. The RiverNorth portion of the team manages about $2 billion in assets. The Oaktree folks between them manage about $200 million in mutual fund assets and $25 billion in private accounts and funds.

Strategy capacity and closure

In the range of $1 billion, a number that the principals agree is pretty squishy. The major capacity limiter is the fund’s CEF strategy. When investors are complacent, CEF discounts shrink which leaves RiverNorth with few opportunities to add arbitrage gains. The managers believe, though, that two factors will help keep the strategy limit high. First, “fear is here to stay,” so investor irrationality will help create lots of mispricing. Second, on March 18 2014, RiverNorth received 12(d)1 exemptive relief from the SEC. That exemption allows the firm to own more than 3% of a CEF’s outstanding shares, which then expands the amount they might profitably invest.

Management’s stake in the fund

The RiverNorth Statement of Additional Information is slightly screwed-up on this point. It lists Mr. Galley as having either $0 (page 33) or “more than $100,000” (page 38). The former is incorrect and the latter doesn’t comply with the standard reporting requirement where the management stake is expressed in bands ($100,000-500,000, $500,000 – $1 million, over $1 million). Mr. O’Neill has between $10,000 and $50,000 in the fund. The Oaktree managers and, if the SAI is correct, the fund’s directors have no investment in the fund.

Opening date

December 28, 2012

Minimum investment

$5,000, reduced to $1,000 for IRAs.

Expense ratio

1.44% for “I” class shares and 1.69% for “R” class shares on assets of $54.9 million, as of July 2023. 

Comments

In good times, markets are reasonably rational. In bad times, they’re bat-poop crazy. The folks are RiverNorth and Oaktree understand you need income regardless of the market’s mood, and so they’ve attempted to create a portfolio which operates well in each. We’ll talk about the strategies and then the managers.

What are these people up to?

The managers will invest in a variable mix of senior loans, high yield bonds and closed-end funds.

High yield bonds are a reasonably well understood asset class. Firms with shaky credit have to pay up to get access to capital. Structurally they’re like other bonds (that is, they suffer in rising rate environments) but much of their attraction arises from the relatively high returns an investor can earn on them. As investors become more optimistic about the economy, the premium they demand from lower-credit firms rises; as their view darkens, the amount of premium they demand rises. Over the past decade, high yield bonds have earned 8.4% annually versus 7.4% for large cap stocks and 6.5% for investment–grade corporate bonds. Sadly, investors crazed for yield have flooded into high-yield bonds, driving up their prices and driving their yield down to 5.4% in late May.

Senior loans represent a $500 billion asset class, which is about the size of the high-yield bond market. They represent loans made to the same sorts of companies which issue high-yield bonds. While the individual loans are private, collections of loans can be bundled together and sold to investors (a process called “securitizing the loans”). These loans have two particularly attractive structural features: they have built-in protection against loss of principal because they’re “senior” in the firm’s capital structure, which means that there’s collateral behind them and their owners would receive preferential treatment in the case of a bankruptcy. Second, they have built-in protection against loss of interest because they’re floating rate loans; as interest rates rise, so does the amount paid to the loan’s owner. These loans have posted positive returns in 15 of the past 16 years (2008 excepted).

In general, these loans yield a lot more than conventional investment grade bonds and operate with a near-zero correlation to the broad bond market.

Higher income. Protection against loss of capital. Protection against rising rates. High diversification value. Got it?

Closed-end funds share characteristics of traditional mutual funds and of other exchange-traded securities, like stocks and ETFs. Like mutual funds, they represent pools of professionally managed securities. The amount that one share of a mutual fund is worth is determined solely by the value of the securities in its portfolio. Like stocks and ETFs, CEFs trade on exchanges throughout the day. The amount one share of a CEF is worth is not the value of the securities in its portfolio; it’s whatever someone is willing to pay you for the share at any particular moment in time. Your CEF share might be backed by $100 in stocks but if you need to sell it today and the most anyone will offer is $70, then that share is worth $70. The first value ($100) is called the CEF’s net asset value (NAV) price, the second ($70) is called its market price. Individual CEFs have trading histories that show consistent patterns of discounts (or premiums). A particular fund might always have a market price that’s 3% below its NAV price. If that fund is sudden available at a 30% discount, an investor might buy a share that’s backed by $100 in securities for $70 and sell it for $97 when panic abates. Even if the market declined 10% in the interim, the investor could still sell a share purchased as $70 for $87 (a 10% NAV decline and a 3% discount) when rationality returns. As a result, you might pocket gains both from picking a good investment and from arbitrage as the irrational discount narrows; that arbitrage gain is independent of the general direction of the market.

RiverNorth/Oaktree High Income combines these three high-income strategies: an interest-rate insensitive loan strategy and a rate-sensitive high-yield one plus an opportunistic market-independent CEF arbitrage strategy.

Who are these guys, and why should we trust them?

Oaktree Capital Management was founded in April 1995 by former TCW professionals. They specialize in specialized credit investing: high yield bonds, convertible securities, distressed debt, real estate and control investments (that is, buying entire firms). They manage about $80 billion for clients on five continents. Among their clients are 100 of the 300 largest global pension plans, 75 of the 100 largest U.S. pension plans, 300 endowments and foundations, 11 sovereign wealth funds and 38 state retirement plans in the United States. Oaktree is widely recognized as an extraordinarily high-quality firm with a high-quality investment discipline.

To be clear: these are not the sorts of clients who tolerate carelessness, unwarranted risk taking or inconsistent performance.

RiverNorth Capital Management pursues strategies in what they consider to be niche markets where inefficiencies abound. They’re the country’s pre-eminent practitioner of closed-end fund arbitrage. That’s most visible in the (closed) RiverNorth Core Opportunity Fund (RNCOX), which has $700 million in assets and five-year returns in the top 13% of all moderate allocation funds. A $10,000 investment made in RNCOX at inception would be worth $19,000 by May 2014 while its average competitor would have returned $14,200.

Their plan is to grow your money steadily and carefully.

Patrick Galley describes this as “a risk-managed, high-yield portfolio” that’s been “constructed to maximize risk-adjusted returns over time, rather than shooting for pure short-term returns.” He argues that this is, in his mind, the central characteristic of a good institutional portfolio: it relies on time and discipline to steadily compound returns, rather than luck and boldness which might cause eye-catching short term returns. As a result, their intention is “wealth preservation: hit plenty of singles and doubles, rely on steady compounding, don’t screw up and get comfortable with the fact that you’re not going to look like a hero in any one year.”

Part of “not screwing up” requires recognizing and responding to the fact that the fund is investing in risky sectors. The managers have the tactical freedom to change the allocation between the three sleeves, depending on evolving market conditions. In the fourth quarter of 2013, for example, the managers observed wide discounts in CEFs and had healthy new capital flows, so they quickly increased CEF allocation to over 40% from a 25-33% neutral position. They’re now harvesting gains, and the CEF allocation is back under 30%.

So far, they’ve quietly done exactly what they planned. The fund is yielding 4.6% over the past twelve months. It has outperformed its multi-sector bond benchmark every quarter so far. Below you can see the comparison of RNOTX (in blue) and its average peer (in orange) from inception through late May 2014.

rnotx

Bottom Line

RNOTX is trying to be the most sensible take possible on investing in promising, risky assets. It combines two sets of extremely distinguished investors who understand the demands of conservative shareholders with an ongoing commitment to use opportunism in the service of careful compounding. While this is not a low-risk fund, it is both risk-managed and well worth the attention of folks who might otherwise lock themselves into a single set of high-yield assets.

Fund website

RiverNorth/Oaktree High Income. Interested in becoming a better investor while you’re browsing the web? You really owe it to yourself to read some of Howard Marks’ memos to Oaktree’s investors. They’re about as good as Buffett and Munger, but far less known by folks in the mutual fund world.

Fact Sheet

[cr2014]

Huber Select Large Cap Value (formerly Huber Capital Equity Income), (HULIX), April 2014

By David Snowball

At the time of publication, this fund was named Huber Equity Income.
This fund was formerly named Huber Capital Equity Income.

Objective and strategy

The Fund is pursuing both current income and capital appreciation. They typically invest in 40 of the 1000 largest domestic large cap stocks. It normally invests in stocks with high cash dividends or payout yields relative to the market but can buy non-payers if they have growth potential unrecognized by the market or have undergone changes in business or management that indicate growth potential.

Adviser

Huber Capital Management, LLC, of Los Angeles. Huber has provided investment advisory services to individual and institutional accounts since 2007. The firm has about $4 billion in assets under management, including $450 million in its three mutual funds.

Manager

Joseph Huber. Mr. Huber was a portfolio manager in charge of security selection and Director of Research for Hotchkis and Wiley Capital Management from October 2001 through March 2007, where he helped oversee over $35 billion in U.S. value asset portfolios. He managed, or assisted with, a variety of successful funds across a range of market caps. He is assisted by seven other investment professionals.

Strategy capacity and closure

Approximately $10 billion. That’s based on their desire to allow each position to occupy about 2% of the fund’s portfolio while not owning a controlling position in any of their stocks. Currently they manage about $1.5 billion in their Select Large Value strategy.

Active share

Not calculated. “Active share” measures the degree to which a fund’s portfolio differs from the holdings of its benchmark portfolio. High active share indicates management which is providing a portfolio that is substantially different from, and independent of, the index. An active share of zero indicates perfect overlap with the index, 100 indicates perfect independence. Mr. Huber, independently enough, dismisses it as “This year’s new risk-control nomenclature. Next year it’ll be something else.” 

Management’s stake in the fund

Mr. Huber has over $1 million invested in each of his three funds. His analysts are all on track to become partners and equity owners of the advisor.

Opening date

June 29, 2007

Minimum investment

$5,000 for regular accounts and $2,500 for retirement accounts.

Expense ratio

1.39% on $85 million in assets, as of July 2023. 

Comments

There’s no question that it works.

None at all.

Morningstar thinks it works:

huber1

Lipper lavishly thinks so:

huber2

And the Observer mostly concurs, recognizing both of the established Huber funds as Great Owls based on their consistently excellent risk-adjusted performance:

huber3

In addition to generating top-tier absolute and risk-adjusted returns, the Huber funds also generate very light tax burdens. By consciously managing when to sells securities (preferably when they qualify for lower long-term rates) and tax-loss harvesting, his investors have lost almost nothing to taxes over the past five years.

It works.

There’s only one question: does it work for you?

Mr. Huber pursues a rigorous, research-driven, value-oriented style. He’s been refining it for 20 years but the core has remained unchanged since his Hotchkis & Wiley days. He has done a lot of reading in behavioral finance and has identified a series of utterly predictable mistakes that investors – his team as much as other folks – are prone to make over and over. His strategy is two-fold:

Exploit other investors’ mistakes. Value investors tend to buy too early and sell too early; growth investors do the opposite. Both sides tend to extrapolate too much from the present, assuming that companies with miserable financials (for example, extremely low return on capital) will continue to flounder. His research demonstrates the inevitability of mean reversion, the currently poorest companies will tend to rise over time and the currently-strongest will fall. By targeting low ROC firms, which most investors dismiss as terminal losers, he harvests over time a sort of arbitrage gain as ROC rises toward the mean on top of market gains.

Guard against his own tendency to make mistakes. He’s created a red flags list, a sort of encyclopedia of all the errors that he or other investors have made, and then subjects each holding to a red flag review. They also have a “negative first to negative second derivative” tool that keeps them from doubling down on a firm whose rate of decline is accelerating and a positive version that might slow down their impulse to sell early.

Beyond that, they do rigorous and distinctive research. While many investors believe that large caps occupy the most efficient part of the market, Mr. Huber strongly disagrees. His argument is that large caps have an enormous number of moving parts, divisions within the firm that have their own management, culture, internal dynamics and financials. Pfizer, a top holding, has divisions specializing in Primary Care; Specialty Care and Oncology; Established Products and Emerging Markets; Animal Health; and Consumer Healthcare. Pfizer need not report the divisions’ financials separately, so many investors are stuck with investing backs on aggregate free cash flow firm-wide and a generic metric about what that flow should be. The Huber folks approach it differently: they start by looking at smaller monoline firms (for example, a firm that just specializes in animal care) which allows them to see that area’s internal dynamics. They then adjust the smaller firm’s financials to reflect what they know of Pfizer’s operations (Pfizer might, for example, have lower cost of capital than the smaller firm). By modeling each unit or division that way and then assembling the parts, they end up with a surrogate for Pfizer as a whole. 

Huber’s success is illustrated when we compare HULIX to three similarly-vintaged large-value funds:

Artisan Value (ARTLX), mostly because Artisan represents consistent excellence and this four-star fund from the U.S. Value team is no exception.

LSV Conservative Core (LSVPX) because LSV’s namesake founders published some 200 papers on behavioral finance and incorporated their research into LSV’s genes.

Hotchkis and Wiley Diversified Value (HWCAX) because Mr. Huber was the guy who built, designed and implemented H&W’s state of the art research program.

huber4

Higher returns, competitive downside, and higher risk-adjusted returns (those are all the ratios on the right where higher is better).

The problem is those returns are accompanied by levels of volatility that many investors are unprepared to accept. It’s a problem that haunted two other Morningstar Manager of the Decade award winners. Here are the markers to keep in mind:

    • Morningstar risk: over the past five years is high.
    • Beta: over the past five years is 1.18, or 18% greater than average.
    • Standard deviation: over the past five years is 18% compared to 14.9 for its peers.
    • Investor returns: by Morningstar’s calculation, the average investor in the fund over the past five years has earned 23.9% while the fund returned 32.1%. That pattern usually reflects bad investor behavior: buying in greed, selling in fear. This pattern is generally associated with funds that are more volatile investors can bear. (There’s an irony in the prospect that investors in the fund might be undone by the very sorts of behavioral flaws that the manager so profitably exploits.)

He also remains fully invested at all times, since he assumes that his clients have made their own asset allocation decisions. His job is to buy the best stocks possible for them, not to decide whether they should be getting conservative or aggressive.

Mr. Huber’s position on the matter is two-fold. First, short-term volatility should have no place in an investor’s decision-making. For the 45 year old with a 40 year investment horizon, nothing that happens over the next 40 months is actually consequential. Second, he and his team try to inform, guide, educate and calm their investors through both written materials and conference calls.

Bottom Line

Huber Equity Income has all the hallmarks of a classic fund: it has a disciplined, distinctive and repeatable process. There’s a great degree of intention and thought in its design.  Its performance, like that of its small cap sibling, is outstanding. It is a discipline well-suited to Huber’s institutional and pension-plan accounts, which contribute 90% of the firm’s assets. Those institutions have long time horizons and, one hopes, the sort of professional detachment that allows them to understand what “investing for the long-term” really entails. The challenge is deciding whether, as a small investor or advisor, you will be able to maintain that same cool, unflustered demeanor. If so, this might be a very, very good move for you.

Fund website

Huber Capital Equity Income Fund

[cr2014]

Poplar Forest Partners Fund (PFPFX), April 2014

By David Snowball

Objective and strategy

The Fund seeks to deliver superior, risk-adjusted returns over full market cycles by investing primarily in a compact portfolio of domestic mid- to large-cap stocks. They invest in between 25-35 stocks. They’re fundamental investors who assess the quality of the underlying business and then its valuation. Factors they consider in that assessment include expected future profits, sustainable revenue or asset growth, and capital requirements of the business which allows them to estimate normalized free cash flow and generate valuation estimates. Typical characteristics of the portfolio:

  • 85% of the portfolio to be invested in investment grade companies
  • 85% of the portfolio to be invested in dividend paying companies
  • 85% of the portfolio to be invested in the 1,000 largest companies in the U.S.

Adviser

Poplar Forest Capital. Poplar Forest was founded in 2007. They launched a small hedge fund, Poplar Forest Fund LP, in October 2007 and their mutual fund in 2009. The firm has just over $1 billion in assets under management, as of March 2014, most of which is in separate accounts for high net worth individuals.

Manager

J. Dale Harvey. Mr. Harvey founded Poplar Forest and serves as their CEO, CIO and Investment Committee Chair. Before that, he spent 16 years at the Capital Group, the advisor to the American Funds. He was portfolio counselor for five different American Funds, accounting for over $20 billion of client funds. He started his career in the Mergers & Acquisitions department of Morgan Stanley. He’s a graduate of the University of Virginia and the business school at Harvard University. He’s been actively engaged in his community, with a special focus on issues surrounding children and families.

Management’s stake in the fund

Over $1 million. “Substantially all” of his personal investment portfolio and the assets of his family’s charitable foundation, along with part of his mom’s portfolio, are invested in the fund. One of the four independent members of his board of directors has an investment (between $50,000 – 100,000) in the fund. In addition, Mr. Harvey owns 82% of the advisor, his analysts own 14% and everyone at the firm is invested in the fund. While individuals can invest their own money elsewhere, “there’s damned little of it” since the firm’s credo is “If you’ve got a great idea, we should own it for our clients.”

Strategy capacity and closure

$6 billion, which is reasonable given his focus on larger stocks. He has approximately $1 billion invested in the strategy (as of March 2014). Given his decision to leave Capital Group out of frustration with their funds’ burgeoning size, it’s reasonable to believe he’ll be cautious about asset growth.

Active share

90.2. “Active share” measures the degree to which a fund’s portfolio differs from the holdings of its benchmark portfolio.  High active share indicates management which is providing a portfolio that is substantially different from, and independent of, the index. An active share of zero indicates perfect overlap with the index, 100 indicates perfect independence. The active share for Poplar Forest is 90.2, which reflects a very high level of independence from its benchmark, the S&P 500 index.

Opening date

12/31/2009

Minimum investment

$25,000, reduced to $5,000 for tax-advantaged accounts. Morningstar incorrectly reports a waiver of the minimum for accounts with automatic investment provisions.

Expense ratio

1.20% on about $319 million in assets. The “A” shares carry a 5% sales load but it is available without a load through Schwab, Vanguard and a few others. The institutional share class (IPFPX) has a 0.95% expense ratio and $1 million minimum.

(as of July 2023)

Comments

Dale Harvey is looking for a few good investors. Sensible people. Not the hot money crowd. Folks who take the time to understand what they’ve invested in, and why. He’s willing to work to find them and to keep them.

That explains a lot.

It explains why he left American Funds, where he had a secure and well-paid position managing funds that were swelling to unmanageable, or perhaps poorly manageable, size. “I wanted to hold 30 names but had to hold 80. We don’t want to be big. We’re not looking for hot money. I still remember the thank-you notes from investors we got when I was young man. Those meant a lot.”

It explains why he chose to have a sales load and a high minimum. He really believes that good advisors add immense value and he wants to support and encourage them. Part of that encouragement is through the availability of a load, part through carefully-crafted quarterly letters that try to be as transparent as possible.  His hope is that he’ll develop “investor-partners” who will stay around long enough for Poplar Forest to make a real difference in their lives.

So far he’s been very pleased with the folks drawn to his fund. He notes that the shareholder turnover rate, industry-wide, is something like 25% a year while Poplar Forest’s rate is in the high teens. That implies a six or seven year holding period. Even during an early rough patch (“we were a year too early buying the banks and our results deviated from the benchmark negatively but we still didn’t see big redemptions”), folks have hung on. 

And, in truth, Mr. Harvey has given them reason to. The fund’s 17.1% annualized return places it in the top 1% of its peer group over the past three years, through March 2014. It has substantially outperformed its peers in three of its first four years; because of his purchase of financial stocks he was, he says, “out of sync in one of four years. Investing is inherently cyclical. It’s worked well for 17 years but that doesn’t mean it works well every year.”

So, what’s he do?  He tries to figure out whether a firm is something he’d be willing to buy 100% of and hold for the next 30 years. If he wouldn’t want to own all of it, he’s unlikely to want to own part of it. There are three parts to the process:

Idea generation: they run screens, read, talk to people, ponder. In particular, “we look for distressed areas. There are places people have lost confidence, so we go in to look for the prospect of babies being tossed with the bathwater.” Energy and materials illustrate the process. A couple years ago he owned none of them, today they’re 20% of the portfolio. Why? “They tend to be highly capital intensive but as the bloom started coming off the rose in China and the emerging markets, we started looking at companies there. A lot are crappy, commodity businesses, but along the way we found interesting possibilities including U.S. natural gas and Alcoa after it got bounced from the Dow.” 

Modeling:  their “big focus is normalized earnings power for the business and its units.” They focus on sustainable earnings growth, a low degree of capital intensity – that is, businesses which don’t demand huge, repeated capital investments to stay competitive – and healthy margins.  They build the portfolio security by security. Because “bond surrogates” were so badly bid up, they own no utilities, no telecom, and only one consumer staple (Avon, which they bought after it cut its dividend).

Reality checks: Mr. Harvey believes that “thesis drift is one of the biggest problems people have.”  An investor buys a stock for a particular reason, the reasoning doesn’t pan out and then they invent a new reason to keep from needing to sell the stock. To prevent that, Poplar Forest conducts a “clean piece of paper review every six months” for every holding. The review starts with their original purchase thesis, the date and price they bought it, and price of the S&P.”  The strategy is designed to force them to admit to their errors and eliminate them.   

Bottom Line

So why might he continue to win?  Two factors stand out. The first is experience: “Pattern recognition is helpful, you know if you’ve seen this story before. It’s like the movies: you recognize a lot of plotlines if you watch a lot of movies.”  The second is independence. Mr. Harvey is one of several independent managers we’ve spoken with who believe that being away from the money centers and their insular culture is a powerful advantage. “There’s a great advantage in being outside the flow that people swim in, in the northeast. They all go to the same meetings, hear the same stuff. If you want to be better than average, you’ve got to see things they don’t.” Beyond that, he doesn’t need to worry about getting fired. 

One of the biggest travesties in the industry today is that everyone is so afraid of being fired that they never differentiate from their benchmarks …  Our business is profitable, guys are getting paid, doing it because I get to do it and not because I’ve got to do it. It’s about great investment results, not some payday.

Fund website

Poplar Forest Partners Fund. While the fund’s website is Spartan, it contains links to some really thoughtful analysis in Mr. Harvey’s quarterly commentaries.  The advisor’s main website is more visually appealing but contains less accessible information.  

Fact Sheet

[cr2014]