Category Archives: Charles

Morningstar Investment Conference 2015 Notes

By Charles Boccadoro

Originally published in July 1, 2015 Commentary
M_Conf_1

In contrast to the perfect pre-autumnal weather of last year’s ETF conference, Chicago was hot and muggy this past week, where some 1500 attendees gathered for Morningstar’s Investment Conference located at the massive, sprawling, and remote McCormick Place.

Morningstar does a great job of quickly publishing conference highlights and greatly facilitates press … large press room wired with high-speed internet, ample snacks and hot coffee, as well as adjacent media center where financial reporters can record fund managers and speakers then quickly post perspectives, like Chuck Jaffe’s good series of audio interviews.

On the MFO Discussion Board, David attempts to post nightly his impressions and linkster Ted relays newly published conference articles. To say the event is well covered would be a colossal understatement.

M_Conf_2

Nonetheless, some impressions for inclusion in this month’s commentary …

If you are a financial adviser not catering to women and millennials, your days are numbered.

On women. Per Sallie Krawcheck, former president of BAC’s Global Wealth division and currently chair of the Ellevate network, which is dedicated to economic engagement of women worldwide, women live six to eight years longer than men … 80% of men die married, while 80% of women die unmarried … 70% of widows leave their financial advisers within a year of their husband’s death.

While women will soon account for majority of US millionaires, most financials advisors don’t include spouses in the conversation. The issue extends to the buy side as well. In a pre-conference session entitled, “Do Women Investors Behave Differently Than Men,” panels cited that women control 51% investable wealth and currently account for 47% of high net worth individuals, yet professional women money managers account for only 5% of assets under management. How can that be?

The consequence of this lack of inclusion is “lack of diversification, higher risk, and money left on table.” Women, they state, value wealth preservation many times more than men. One panelist actually argues that women are better suited to handle the stress hormone cortisol since they need not suffer adverse consequences of interaction with testosterone.

While never said explicitly, I could not help but wonder if the message or perhaps question here is: If women played a greater role in financial institutions and at the Fed in years leading up to 2007, would we have avoided the financial or housing crises?  

On millennials. Per Joel Brukenstein of Financial Planning Magazine and creator of Technology Tools for Today website, explains that the days of financial advisors charging 1% annual fee for maintaining a client portfolios of four or five mutual funds are no longer sustainable … replaced with a proliferation of robo-advisors, like Schwab Intelligent Portfolios, which charges “no advisory fees, no account service fees, no commissions, period.”

Ditto, if your services are not available on a smart phone. Millennials are beyond internet savvy and mobile … all data/tools must be accessible via the cloud.

Mr. Brukenstein went so far as to suggest that financial advisors not offering services beyond portfolio management should consider exiting the business.

M_Conf_3

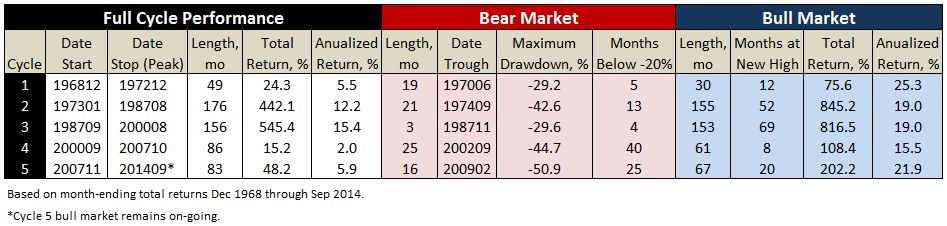
Keynote highlights. Jeremy Grantham, British-born co-founder of Boston-based asset management firm GMO, once again reiterated his belief that US stocks are 30 – 60% overvalued, still paying for overvaluation sins of our fathers … the great bull run of 1990, which started in 1987, finished in 2000, and was right on the heels of the great bull run of the 1980s. No matter that investors have suffered two 50% drawdowns the past 15 years with the S&P 500 and only received anemic returns, “it will take 25 years to get things right again.” So, 10 more years of suffering I’m afraid.

He blames Greenspan, Bernanke, and Yellen for distorting valuations, the capital markets, the zero interest rate policy … leading to artificially inflated equity prices and a stock-option culture that has resulted in making leaders of publically traded companies wealthy at the expense of capital investment, which would benefit the many. “No longer any room for city or community altruism in today’s capitalism … FDR’s social contract no more.”

All that said he does not see the equity bubble popping just yet … “no bubble peaks before abnormal buyers and deals come to market.” He predicts steady raise until perhaps coming presidential election.

Mr. Grantham is not a believer in efficient market theory. He views the cycles of equity expansion and contraction quite inefficiently driven by career risk (never be wrong on your own …), herding, momentum, extrapolation, excursions from replacement value, then finally, arbitrage and mean reversion at expense of client patience. Round and round it goes.

M_Conf_4

David Kelly, JP Morgan’s Chief Global Strategist whose quarterly “Guide To Markets” now reaches 169 thousand individuals in 25 countries, also does not see a bear market on horizon, which he believes would be triggered by one or more of these four events/conditions: recession, commodity spike, aggressive fed tightening, and/or extreme valuation. He sees none of these.

He sees current situation in Greece as a tragedy … Germany was too tough during recession. Fortunately, 80% of Greek debt is held by ECB, not Euro banks, so he sees no lasting domino effect if it defaults.

On the US economy, he sees it “not booming, but bouncing back.” Seven years into recovery, which represents the fourth longest expansion dating back to 1900. “Like a Yankees/Red Sox game … long because it is slow.”

He disputes Yellen’s position that there is slack in the economy, citing that last year 60 million people were hired … an extraordinary amount. (That is the gross number; subtract 57 million jobs left, for a net of 3 million.) The biggest threat to continued expansion is lack of labor force, given retiring baby boomers, 12.5 of population with felony convictions, scores addicted to drug, and restrictions on foreign nationals, which he calls the biggest tragedy: “We bring them in. They want to be here. We educate them. They are top of class. Then, we send them home. It’s crazy. We need immigration reform to allow skilled workers to stay.”

Like Grantham, he does see QE helping too much of the wrong thing at this point: “Fertilizer for weeds.”

On oil, which he views like potatoes – a classic commodity: “$110 is too much, but $40 is too low.” Since we have “genetically evolved to waste oil,” he believes now is good time to get in cause “prices have stabilized and will gradually go up.”

Like last fall, he continues to see EM cheap and good long term opportunity. Europe valuations ok … a mid-term opportunity.

He closed by remaining us that investors need courage during bear markets and brains during bull markets.

M_Conf_5

Breakout sessions. Wasatch’s Laura Geritz was stand-out panelist in break-out session “Are Frontier Markets Worth Pursuing?” She articulately described likes (“Active manager’s dream asset class … capital held dear by phenomenal FM management teams … investments by strong subsidiaries, like Nestle … China’s investment in FM … ”) and dislikes (“No practical index … current indices remain too correlated due to lack of diversification … lack of market liquidity …”). She views FM as strictly long-term investment proposition with lots of ups and downs, but ultimately compelling. If you have not listened to her interview with Chuck Jaffe, you should.

Another break-out session, panelists discussed the current increasing popularity of “ESG Investing.” (ESG stands for environmental, social, and governance. ESG funds, currently numbering more than 200, apply these criteria in their investments.) “Ignore increasingly at your own peril … especially given that women and millennials represent the biggest demographic on horizon.” Interestingly, data suggest such funds do just as well if not slightly better than the overall market.

Outliers

By Charles Boccadoro

outliersOriginally published in June 1, 2015 Commentary

“At the extreme outer edge of what is statistically plausible” is how Malcom Gladwell defines an outlier in his amazing book, Outliers: The Story of Success (2008).

The MFO Rating System ranks funds based on risk adjusted return within their respective categories across various evaluation periods. The rankings are by quintile. Those in the top 20 percentile are assigned a 5, while those in the bottom 20 percentile are assigned a 1.

The percentile is not determined from simple rank ordering. For example, say there are 100 funds in the Large Growth category. The 20 funds with the highest risk adjusted return may not necessarily all be given a 5. That’s because our methodology assumes fund performance will be normally distributed across the category, which means terms like category mean and standard deviation are taken into account.

It’s similar to grading tests in school using a bell curve and, rightly or wrongly, is in deference to the random nature of returns. While not perfect, this method produces more satisfactory ranking results than the simple rank order method because it ensures, for example, that the bottom quintile funds (Return Group 1) have returns that are so many standard deviations below the mean or average returning funds (Return Group 3). Similarly, top quintile funds (Return Group 5) will have returns that are so many standard deviations above the mean.

bellcurve

All said, there remain drawbacks. At times, returns can be anything but random or “normally” distributed, which was painfully observed when the hedge fund Long-Term Capital Management (LTCM) collapsed in 1998. LTCM used quant models with normal distributions that underestimated the potential for extreme under performance. Such distributions can be skewed negatively, creating a so-called “left tail” perhaps driven by a market liquidity crunch, which means that the probability of extreme under-performance is higher than depicted on the left edge of the bell curve above.

Then there are outliers. Funds that over- or under-perform several standard deviations away from the mean. Depending on the number of funds in the category being ranked, these outliers can meaningfully alter the mean and standard deviation values themselves. For example, if a category has only 10 funds and one is an outlier, the resulting rankings could have the outlier assigned Return Group 5 and all others relegated to Return Group 1.

The MFO methodology removes outliers, anointing them if you will to bottom or top quintile, then recalculates rankings of remaining funds. It keeps track of the outliers across the evaluation periods ranked. Below please find a list of positive outliers, or extreme over-performers, based on the latest MFO Ratings of some 8700 funds, month ending April 2015.

The list contains some amazing funds and warrants a couple observations:

  • Time mitigates outliers, which seems to be a manifestation of reversion to the mean, so no outliers are observed presently for periods beyond 205 or so months, or about 17 years.
  • Outliers rarely repeat across different time frames, sad to say but certainly not unexpected as observed in In Search of Persistence.
  • Outliers typically protect against drawdown, as evidenced by low Bear Decile score and Great Owl designations (highlighted in dark blue – Great Owls are assigned to funds that have earned top performance rank based on Martin for all evaluation periods 3 years or longer).

The following outliers have delivered extreme over-performance for periods 10 years and more (the tables depict 20 year or life metrics, as applicable):

10yr_1

10yr_2

Here are the outliers for periods 5 years and more (the tables depict 10 year or life metrics, as applicable):

5yr-1

5yr-2

Finally, the outliers for periods 3 years and more (the tables depict 5 year or life metrics, as applicable):

3yr-1

3yr-2

How Good Is Your Fund Family? An Update…

By Charles Boccadoro

Originally published in May 1, 2015 Commentary

Baseball season has started. MLB.TV actually plays more commercials than it used to, which sad to say I enjoy more than the silent “Commercial Break In Progress” screen, even if they are repetitive.

One commercial is for The Hartford Funds. The company launched a media campaign introducing a new tagline, “Our benchmark is the investor℠,” and its focus on “human-centric investing.”

fundfamily_1

Its website touts research they have done with MIT on aging, and its funds are actually sub-advised by Wellington Management.

A quick look shows 66 funds, each with some 6 share classes, and just under $100B AUM. Of the 66, most charge front loads up to 5.5% with an average annual expense ratio of just over 1%, including 12b-1 fee. And, 60 have been around for more than 3 years, averaging 15 years in fact.

How well have their funds performed over their lifetimes? Just average … a near even split between funds over-performing and under-performing their peers, including expenses.

We first started looking at fund family performance last year in the piece “How Good Is Your Fund Family?” Following much the same methodology, with all the same qualifications, below is a brief update. Shortly, we hope to publish an ongoing tally, or “Fund Family Score Card” if you will, because … during the next commercial break, while watching a fund family’s newest media campaign, we want to make it easier for you to gauge how well a fund family has performed against its peers.

The current playing field has about 6200 US funds packaged and usually marketed in 225 families. For our tally, each family includes at least 5 funds with ages 3 years or more. Oldest share class only, excluding money market, bear, trading, and specialized commodity funds. Though the numbers sound high, the field is actually dominated by just five families, as shown below:

fundfamily_2

It is interesting that while Vanguard represents the largest family by AUM, with nearly twice its nearest competitor, its average annual ER of 0.22% is less than one third either Fidelity or American Funds, at 0.79% and 0.71%, respectively. So, even without front loads, which both the latter use to excess, they are likely raking in much more in fees than Vanguard.

Ranking each of the 225 families based on number of funds that beat their category averages produces the following score card, by quintile, best to worst:

fundfamily_3afundfamily_3bfundfamily_3cfundfamily_3dfundfamily_3e

Of the five families, four are in top two quintiles: Vanguard, American Funds, Fidelity, and T. Rowe Price.  In fact, of Vanguard’s 145 funds, 119 beat their peers. Extraordinary. But BlackRock is just average, like Hartford.

The difference in average total return between top and bottom fund families on score card is 3.1% per year!

The line-ups of some of the bottom quintile families include 100% under-performers, where every fund has returned less than its peers over their lifetimes: Commonwealth, Integrity, Lincoln, Oak Associates, Pacific Advisors, Pacific Financial, Praxis, STAAR. Do you think their investors know? Do the investors of Goldman Sachs know that their funds are bottom quintile … written-off to survivorship bias possibly?

Visiting the website of Oberweis, you don’t see that four of its six funds under-performed. Instead, you find: TWO FUNDS NAMED “BEST FUND” IN 2015 LIPPER AWARDS. Yes, its two over-performers.

While the line-ups of some top quintile families include 100% over-performers: Cambiar, Causeway, Dodge & Cox, First Eagle, Marsico, Mirae, Robeco, Tocqueville.

Here is a summary of some of the current best and worst:

fundfamily_4

While not meeting the “five funds” minimum, some other notables: Tweedy Browne has 4 of 4 over-performers, and Berwyn, FMI, Maris & Power, Meridian all have 3 of 3.  As well as younger families off to great starts: KP, 14 of 14 over-performers, Rothschild 7 of 7, Gotham 5 of 5, and Grandeur Peak 4 of 4. We will find a way to call attention to these funds too on the future “Fund Family Score Card.”

Identifying Bear-Market Resistant Funds During Good Times

By Charles Boccadoro

Originally published in April 1, 2015 Commentary

It’s easy enough to look back at the last bear market to see which funds avoided massive drawdown. Unfortunately, portfolio construction of those same funds may not defend against the next bear, which may be driven by different instabilities.

Dodge & Cox Balanced Fund (DODBX) comes to mind. In the difficult period between August 2000 and September 2002, it only drew down 11.6% versus the S&P 500’s -44.7% and Vanguard’s Balanced Index VBINX -22.4%. Better yet, it actually delivered a healthy positive return versus a loss for most balanced funds.

Owners of that fund (like I was and remain) were disappointed then when during the next bear market from November 2007 to February 2009, DODBX performed miserably. Max drawdown of -45.8%, which took 41 months to recover, and underperformance of -6.9% per year versus peers. A value-oriented fund house, D&C avoided growth tech stocks during the 2000 bubble, but ran head-on into the financial bubble of 2008. Indeed, as the saying goes, not all bear markets are the same.

Similarly, funds may have avoided or tamed the last bear by being heavy cash, diversifying into uncorrelated assets, hedging or perhaps even going net short, only to underperform in the subsequent bull market. Many esteemed fund managers are in good company here, including Robert Arnott, John Hussman, Andrew Redleaf, Eric Cinnamond to name a few.

Morningstar actually defines a so-called “bear-market ranking,” although honestly this metric must be one of least maintained and least acknowledged on its website. “Bear-market rankings compare how funds have held up during market downturns over the past five years.” The metric looks at how funds have performed over the past five years relative to peers during down months. Applying the methodology over the past 50 years reveals just how many “bear-market months” investors have endured, as depicted in the following chart:

bmdev_1

The long term average shows that equity funds experience a monthly drop below 3% about twice a year and fixed income funds experience a drop below 1% about three times every two years. There have been virtually no such drops this past year, which helps explain the five-year screening window.

The key question is whether a fund’s performance during these relatively scarce down months is a precursor to its performance during a genuine bear market, which is marked by a 20% drawdown from previous peak for equity funds.

Taking a cue from Morningstar’s methodology (but tailoring it somewhat), let’s define “bear market deviation (BMDEV)” as the downside deviation during bear-market months. Basically, BMDEV indicates the typical percentage decline based only on a fund’s performance during bear-market months. (See Ratings System Definitions and A Look at Risk Adjusted Returns.)

The bull market period preceding 2008 was just over five years, October 2002 through October 2007, setting up a good test case. Calculating BMDEV for the 3500 or so existing funds during that period, ranking them by decile within peer group, and then assessing subsequent bear market performance provides an encouraging result … funds with the lowest bear market deviation (BMDEV) well out-performed funds with the highest bear market deviation, as depicted below.

bmdev_2

Comparing the same funds across the full cycle reveals comparable if not superior absolute return performance of funds with the lowest bear market deviation. A look at the individual funds includes some top performers:  

bmdev_3

The correlation did not hold up in all cases, of course, but it is a reminder that the superior return often goes hand-in-hand with protecting the downside.

Posturing then for the future, which funds have the lowest bear-market deviation over the current bull market? Evaluating the 5500 or so existing funds since March 2009 produces a list of about 450 funds. Some notables are listed below and the full list can be downloaded here. (Note: The full list includes all funds with lowest decile BMDEV, regardless of load, manager change, expense ratio, availability, min purchase, etc., so please consider accordingly.)

bmdev_4

All of the funds on the above list seem to make a habit of mitigating drawdown, experiencing a fraction of the market’s bear-market months. In fact, a backward look of the current group reveals similar over-performance during the financial crisis when compared to those funds with the highest BMDEV.

Also, scanning through the categories above, it appears quite possible to have some protection against downside without necessarily resorting to long/short, market neutral, tactical allocation, and other so-called alternative investments. Although granted, the time frame for many of the alternatives categories is rather limited.

In any case, perhaps there is something to be said for “bear-market rankings” after all. Certainly, it seems a worthy enough risk metric to be part of an investor’s due diligence. We will work to make available updates of bear-market rankings for all funds to MFO readers in the future.

Meb Faber’s New Book

By Charles Boccadoro

Global-Asset-Allocation-with-border-683x1024Originally published in March 1, 2015 Commentary

Official publication date is tomorrow, March 2.

Like his last two books, Shareholder Yield and Global Value, reviewed in last year’s May commentary, his new book “Global Asset Allocation: A Survey of the World’s Top Asset Allocation Strategies” is a self-published ebook available on Amazon for just $2.99.

On his blog, Mr. Faber states “my goal was to keep it short enough to read in one sitting, evidence-based with a basic summary that is practical and easily implementable.”

That description is true of all Meb’s books, including his first published by Wiley in 2009, The Ivy Portfolio. To celebrate he’s making downloads of Shareholder Yield and Global Value available for free.

We will review his new book next time we check-in on Cambria’s ETF performance.


Here appears to be its Table of Contents:

INTRODUCTION

CHAPTER 1 – A History of Stocks, Bonds, and Bills

CHAPTER 2 – The Benchmark Portfolio: 60/40

CHAPTER 3 – Asset Class Building Blocks

CHAPTER 4 – The Risk Parity and All Seasons Portfolios

CHAPTER 5 – The Permanent Portfolio

CHAPTER 6 – The Global Market Portfolio

CHAPTER 7 – The Rob Arnott Portfolio

CHAPTER 8 – The Marc Faber Portfolio

CHAPTER 9 – The Endowment Portfolio: Swensen, El-Erian, and Ivy

CHAPTER 10 – The Warren Buffett Portfolio

CHAPTER 11 – Comparison of the Strategies

CHAPTER 12 – Implementation (ETFs, Fees, Taxes, Advisors)

CHAPTER 13 – Summary

APPENDIX A – FAQs

Whitebox Tactical Opportunities 4Q14 Conference Call

By Charles Boccadoro

wbmix_logo

Originally published in March 1, 2015 Commentary

Portfolio managers Andrew Redleaf and Dr. Jason Cross, along with Whitebox Funds’ President Bruce Nordin and Mike Coffey, Head of Mutual Fund Distribution, hosted the 4th quarter conference call for their Tactical Opportunities Fund (WBMIX) on February 26. Robert Vogel and Paul Twitchell, the fund’s third and fourth portfolio managers, did not participate.

Prolific MFO board contributor Scott first made us aware of the fund in August 2012 with the post “Somewhat Interesting Tiny Fund.” David profiled its more market neutral and less tactical (less directionally oriented) sibling WBLFX in April 2013. I discussed WBMIX in the October 2013 commentary, calling the fund proper “increasingly hard to ignore.” Although the fund proper was young, it possessed the potential to be “on the short list … for those who simply want to hold one all-weather fund.”

WBMIX recently pasted its three year mark and at $865M AUM is no longer tiny. Today’s question is whether it remains an interesting and compelling option for those investors looking for alternatives to the traditional 60/40 balanced fund at a time of interest rate uncertainty and given the two significant equity drawdowns since 2000.

Mr. Redleaf launched the call by summarizing two major convictions:

  • The US equity market is “expensive by just about any measure.” He noted examples like market cap to GDP or Shiller CAPE, comparing certain valuations to pre great recession and even pre great depression. At such valuations, expected returns are small and do not warrant the downside risk they bear, believing there is a “real chance of 20-30-40 even 50% retraction.” In short, “great risk in hope of small gain.”
  • The global markets are fraught with risk, still recovering from the great recession. He explained that we were in the “fourth phase of government action.” He called the current phase competitive currency devaluation, which he believes “cannot work.” It provides temporary relief at best and longer term does more harm than good. He seems to support only the initial phase of government stimulus, which “helped markets avert Armageddon.” The last two phases, which included the zero interest rate policy (ZIRP), have done little to increase top-line growth.

Consequently, toward middle of last year, Tactical Opportunities (TO) moved away from its long bias to market neutral. Mr. Redleaf explained the portfolio now looks to be long “reasonably priced” (since cheap is hard to find) quality companies and be short over-priced storybook companies (some coined “Never, Nevers”) that would take many years, like 17, of uninterrupted growth to justify current prices.

The following table from its recent quarterly commentary illustrates the rationale:

wbmix_0

Mr. Redleaf holds a deep contrarian view of efficient market theory. He works to exploit market irrationalities, inefficiencies, and so-called dislocations, like “mispriced securities that have a relationship to each other,” or so-called “value arbitrage.” Consistently guarding against extreme risk, the firm would never put on a naked short. Its annual report reads “…a hedge is itself an investment in which we believe and one that adds, not sacrifices returns.”

But that does not mean it will not have periods of underperformance and even drawdown. If the traditional 60/40 balanced fund performance represents the “Mr. Market Bus,” Whitebox chose to exit middle of last year. As can be seen in the graph of total return growth since WBMIX inception, Mr. Redleaf seems to be in good company.

wbmix_1

Whether the “exit” was a because of deliberate tactical moves, like a market-neutral stance, or because particular trades, especially long/short trades went wrong, or both … many alternative funds missed-out on much of the market’s gains this past year, as evidenced in following chart:

wbmix_2

But TO did not just miss much of the upside, it’s actually retracted 8% through February, based on month ending total returns, the greatest amount since its inception in December 2011; in fact, it has been retracting for ten consecutive months. Their explanation:

Our view of current opportunity has been about 180 degrees opposite Mr. Market’s. Currently, we love what we’d call “intelligent value” while Mr. Market apparently seems infatuated with what we’d call “unsustainable growth.”

Put bluntly, the stocks we disfavored most (and were short) were among the stocks investors remained enamored with.

A more conservative strategy would call for moving assets to cash. (Funds like ASTON RiverRoad Independent Value, which has about 75% cash. Pinnacle Value at 50%. And, FPA Crescent at 44%.) But TO is more aggressive, with attendant volatilities above 75% of SP500, as it strives to “produce competitive returns under multiple scenarios.” This aspect of the fund is more evident now than back in October 2013.

Comparing its performance since launch against other long-short peers and some notable alternatives, WBMIX now falls in the middle of the pack, after a strong start in 2012/13 but disappointing 2014:

wbmix_3

From the beginning, Mr. Redleaf has hoped TO would be judged in comparison to top endowments. Below are a couple comparisons, first against Yale and Harvard, which report on fiscal basis, and second against a simple Ivy asset allocation (computed using Alpha Architect’s Allocation Tool) and Vanguard’s 60/40 Balanced Index. Again, a strong showing in 2012/13, but 2014 was a tough year for TO (and Ivy).

wbmix_4

Beyond strategy and performance, the folks at Whitebox continue to distinguish themselves as leaders in shareholder friendliness – a much welcomed and refreshing attribute, particularly with former hedge fund shops now offering the mutual funds and ETFs. Since last report:

  • They maintain a “culture of transparency and integrity,” like their name suggests providing timely and thoughtful quarterly commentaries, published on their public website, not just for advisors. (In stark contrast to other firms, like AQR Funds, which in the past have stopped publishing commentaries during periods of underperformance, no longer make commentaries available without an account, and cater to Accredited Investors and Qualified Eligible Persons.)
  • They now benchmark against SP500 total return, not just SPX.
  • They eliminated the loaded advisor share class.
  • Their expense ratio is well below peer average. Institutional shares, available at some brokerages for accounts with $100K minimum, have been running between 1.25-1.35%. They impose a voluntary cap of 1.35%, which must be approved by its board annually, but they have no intention of ever raising … just the opposite as AUM grows, says Mr. Coffey. (The cap is 1.6% for investor shares, symbol WBMAX.)

These ratios exclude the mandatory reporting of dividend and interest expense on short sales and acquired fund fees, which make all long/short funds inherently more expensive than long only equity funds. The former has been running about 1%, while the latter is minimal with selective index ETFs.

  • They do not charge a short-term redemption fee.

All that said, they could do even better going forward:

  • While Mr. Redleaf has over $1M invested directly with the fund, the most recent SAI dated 15 January 2015, indicates that the other three portfolio managers have zero stake. A spokesman for the fund defends “…as a smaller company, the partners’ investment is implicit rather than explicit. They have ‘Skin in the game,’ as a successful Tac Ops increases Whitebox’s profitability and on the other side of the coin, they stand to lose.”

David, of course, would argue that there is an important difference: Direct shareholders of a fund gain or lose based on fund performance, whereas firm owners gain or lose based on AUM.

Ed, author of two articles on “Skin in the Game” (Part I & Part II), would warn: “If you want to get rich, it’s easier to do so by investing the wealth of others than investing your own money.”

  • Similarly, the SAI shows only one of its four trustees with any direct stake in the fund.
  • They continue to impose a 12b-1 fee on their investor share class. A simpler and more equitable approach would be to maintain a single share class eliminating this fee and continue to charge lowest expenses possible.
  • They continue to practice a so-called “soft money” policy, which means the fund “may pay higher commission rates than the lowest available” on broker transactions in exchange for research services. Unfortunately, this practice is widespread in the industry and investors end-up paying an expense that should be paid for by the adviser.

In conclusion, does the fund’s strategy remain interesting? Absolutely. Thoughtfulness, logic, and “arithmetic” are evident in each trade, in each hedge. Those trades can include broad asset classes, wherever Mr. Redleaf and team deem there are mispriced opportunities at acceptable risk.

Another example mentioned on the call is their longstanding large versus small theme. They believe that small caps are systematically overpriced, so they have been long on large caps while short on small caps. They have seen few opportunities in the credit markets, but given the recent fall in the energy sector, that may be changing. And, finally, first mentioned as a potential opportunity in 2013, a recent theme is their so-called “E-Trade … a three‐legged position in which we are short Italian and French sovereign debt, short the euro (currency) via put options, and long US debt.”

Does the fund’s strategy remain compelling enough to be a candidate for your one all-weather fund? If you share a macro-“market” view similar to the one articulated above by Mr. Redleaf, the answer to that may be yes, particularly if your risk temperament is aggressive and your timeline is say 7-10 years. But such contrarianism comes with a price, shorter-term at least.

During the call, Dr. Cross addressed the current drawdown, stating that “the fund would rather be down 8% than down 30% … so that it can be positioned to take advantage.” This “positioning” may turn out to be the right move, but when he said it, I could not help but think of a recent post by MFO board member Tampa Bay:

“Far more money has been lost by investors preparing for corrections, or trying to anticipate corrections, than has been lost in corrections themselves.” – Peter Lynch 

Mr. Redleaf is no ordinary investor, of course. His bet against mortgages in 2008 is legendary. Whitebox Advisers, LLC, which he founded in 1999 in Minneapolis, now manages more than $4B.

He concluded the call by stating the “path to victory” for the fund’s current “intelligent value” strategy is one of two ways: 1) a significant correction from current valuations, or 2) a fully recovered economy with genuine top-line growth.

Whitebox Tactical Opportunities is facing its first real test as a mutual fund. While investors may forgive not making money during an upward market, they are notoriously unforgiving losing money (eg., Fairholme 2011), perhaps unfairly and perhaps to their own detriment, but even over relatively short spans and even if done in pursuit of “efficient management of risk.”

Newest ETFs from Cambria Funds and AlphaArchitect

By Charles Boccadoro

Originally published in January 1, 2015 Commentary

header-logo
Cambria Funds recently launched two ETFs, as promised by its CIO Mebane Faber, who wants to “disrupt the traditional high fee mutual fund and hedge fund business, mostly through launching ETFs.” The line-up is now five funds with assets under management totaling more than $350M:

  • Cambria Shareholder Yield ETF (SYLD)
  • Cambria Foreign Shareholder Yield ETF (FYLD)
  • Cambria Global Value ETF (GVAL)
  • Cambria Global Momentum ETF (GMOM)
  • Cambria Global Asset Allocation ETF (GAA)

We wrote about the first three in “The Existential Pleasures of Engineering Beta” this past May. SYLD is now the largest actively managed ETF among the nine categories in Morningstar’s equity fund style box (small value to large growth). It’s up 12% this year and 32% since its inception May 2013.

GMOM and GAA are the two newest ETFs. Both are fund of funds.

GMOM is based on Mebane’s definitive paper “A Quantitative Approach To Tactical Asset Allocation” and popular book “The Ivy Portfolio: How to Invest Like the Top Endowments and Avoid Bear Markets.” It appears to be an in-house version of AdvisorShares Cambria Global Tactical ETF (GTAA), which Cambria stopped sub-advising this past June. Scott, a frequent and often profound contributor to our discussion board, describes GTAA in one word: “underwhelming.” (You can find follow some of the debate here.) The new version GMOM sports a much lower expense ratio, which can only help. Here is link to fact sheet.

GAA is something pretty cool. It is an all-weather strategic asset allocation fund constructed for global exposure across diverse asset classes, but with lower volatility than your typical long term target allocation fund. It is a “one fund for a lifetime” offering. (See DailyAlts “Meb Faber on the Genesis of Cambria’s Global Tactical ETF.”) It is the first ETF to have a permanent 0% management fee. Its annual expense ratio is 0.29%. From its prospectus:

GAA_1

Here’s is link to fact sheet, and below is snapshot of current holdings:

GAA_2

In keeping with the theme that no good deed goes unpunished. Chuck Jaffe referenced GAA in his annual “Lump of Coal Awards” series. Mr. Jaffe warned “investors should pay attention to the total expense ratio, because that’s what they actually pay to own a fund or ETF.” Apparently, he was irked that the media focused on the zero management fee. We agree that it was pretty silly of reporters, members of Mr. Jaffe’s brotherhood, to focus so narrowly on a single feature of the fund and at the same time celebrate the fact that Mr. Faber’s move lowers the expenses that investors would otherwise bear.

aa_icon
Wesley Gray announced the launch of ValueShares International Quantitative Value ETF (IVAL) on 19 December, his firm’s second active ETF. IVAL is the international sister to ValueShares Quantitative Value ETF (QVAL), which MFO profiled in December. Like QVAL, IVAL seeks the cheapest, highest quality value stocks … within the International domain. These stocks are selected in quant fashion based on value and quality criteria grounded in investing principles first outlined by Ben Graham and validated empirically through academic research.

The concentrated portfolio currently invests in 50 companies across 14 countries. Here’s breakout:

IVAL_Portfolio

As with QVAL, there is no sector diversification constraint or, in this case, country constraint. Japan dominates current portfolio. Once candidate stocks pass the capitalization, liquidity, and quality screens, value is king.

Notice too no Russia or Brazil.

Wesley explains: “We only trade in liquid tradeable names where front-running issues are minimized. We also look at the custodian costs. Russia and Brazil are insane on both the custodial costs and the frontrunning risks so we don’t trade ’em. In the end, we’re trading in developed/developing markets. Frontier/emerging don’t meet our criteria.”

Here is link to IVAL overview. Dr. Gray informs us that the new fund’s expense ratio has just been reduced by 20bps to 0.79%.

Where In The World Is Your Fund Adviser?

By Charles Boccadoro

Originally published in January 1, 2015 Commentary

When our esteemed colleague Ed Studzinski shares his views on an adviser or fund house, he invariably mentions location.

I’ve started to take notice.

Any place but Wall Street
Some fund advisers seem to identify themselves with their location. Smead Capital Management, Inc., which manages Smead Value Fund (SMVLX), states: ”Our compass bearings are slightly Northwest of Wall Street…” The firm is headquartered in Seattle.

location_1a

SMVLX is a 5-year Great Owl sporting top quintile performance over the past 5-, 3-, and even 1-year periods (ref. Ratings Definitions):

Bill Smead believes the separation from Wall Street gives his firm an edge.

location_b

Legendary value investor Bruce Berkowitz, founder of Fairholme Capital Management, LLC seems to agree. Fortune reported that he moved the firm from New Jersey to Florida in 2006 in order to … ”put some space between himself and Wall Street … no matter where he went in town, he was in danger of running into know-it-all investors who might pollute his thinking. ’I had to get away,’ he says.”

In 2002, Charles Akre of Akre Capital Management, LLC, located his firm in Middleburg, Virginia. At that time, he was sub-advising Friedman, Billings, Ramsey & Co.’s FBR Focus Fund, an enormously successful fund. The picturesque town is in horse country. Since 2009, the firm’s Akre Focus Fund (AKREX/AKRIX) is a top-quintile performer and another 5-year Great Owl:

location_c

location_d

Perhaps location does matter?

Tales of intrigue and woe
Unfortunately, determining an adviser’s actual work location is not always so apparent. Sometimes it appears downright labyrinthine, if not Byzantine.

Take Advisors Preferred, LLC. Below is a snapshot of the firm’s contact page. There is no physical address. No discernable area code. Yet, it is the named adviser for several funds with assets under management (AUM) totaling half a billion dollars, including Hundredfold Select Alternative (SFHYX) and OnTrack Core Fund (OTRFX).

location_e

Advisors Preferred turns out to be a legal entity that provides services for sub-advisers who actually manage client money without having to hassle with administrative stuff … an “adviser” if you will by name only … an “Adviser for Hire.” To find addresses of the sub-advisers to these funds you must look to the SEC required fund documents, the prospectus or the statement of additional information (SAI).

Hunderdfold Funds is sub-advised by Hunderdfold Funds, LLC, which gives its sub-advisory fees to the Simply Distribute Charitable Foundation. Actually, the charity appears to own the sub-adviser. Who controls the charity? The people that control Spectrum Financial Inc., which is located, alas, in Virginia.

The SAI also reveals that the fund’s statutory trust is not administered by the adviser, Advisors Preferred, but by Gemini Funds Services, LLC. The trust itself is a so-called shared or “series trust” comprised of independent funds. Its name is Northern Lights Fund Trust II. (Ref. SEC summary.) The trust is incorporated in Delaware, like many statutory trusts, while Gemini is headquartered in New York.

Why use a series trust? According to Gemini, it’s cheaper. “Rising business costs along with the increased level of regulatory compliance … have magnified the benefits of joining a shared trust in contrast to the expenses associated with registering a standalone trust.”

How does Hundredfold pass this cost savings on to investors? SFHYX’s latest fact sheet shows a 3.80% expense ratio. This fee is not a one-time load or performance based; it is an annual expense.

OnTrack Funds is sub-advised by Price Capital Management, Inc, which is located in Florida. Per the SEC Filing, it actually is run out of a residence. Its latest fact sheet has the expense ratio for OTRFX at 2.95%, annually. With $130M AUM, this expense translates to $3.85M per year paid by investors the people at Price Capital (sub adviser), Gemini Funds (administrator), Advisors Preferred (adviser), Ceros Financial (distributer), and others.

What about the adviser itself, Advisors Preferred? It’s actually controlled by Ceros Financial Services, LLC, which is headquartered in Maryland. Ceros is wholly-owned by Ceros Holding AG, which is 95% owned by Copiaholding AG, which is wholly-owned by Franz Winklbauer.  Mr. Winklbauer is deemed to indirectly control the adviser. In 2012, Franz Winklbauer resigned as vice president of the administrative board from Ceros Holding AG. Copiaholding AG was formed in Switzerland.

location_f

Which is to say … who are all these people?

Where do they really work?

And, what do they really do?

Maybe these are related questions.

If it’s hard to figure out where advisers work, it’s probably hard to figure out what they actually do for the investors that pay them.

Guilty by affiliation
Further obfuscating adviser physical location is industry trend toward affiliation, if not outright consolidation. Take Affiliated Managers Group, or more specifically AMG Funds LLC, whose main office location is Connecticut, as registered with the SEC. It currently is the named adviser to more than 40 mutual funds with assets under management (AUM) totaling $42B, including:

  • Managers Intermediate Duration Govt (MGIDX), sub advised by Amundi Smith Breeden LLC, located in North Carolina,
  • Yacktman Service (YACKX), sub advised by Yacktman Asset Management, L.P. of Texas, and
  • Brandywine Blue (BLUEX), sub advised by Friess Associates of Delaware, LLC, located in Delaware (fortunately) and Friess Associates LLC, located in Wyoming.

All of these funds are in process of being rebranded with the AMG name. No good deed goes unpunished?

AMG, Inc., the corporation that controls AMG Funds and is headquartered in Massachusetts, has minority or majority ownership in many other asset managers, both in the US and aboard. Below is a snapshot of US firms now “affiliated” with AMG. Note that some are themselves named advisers with multiple sub-advisers, like Aston.

location_g

AMG describes its operation as follows: “While providing our Affiliates with continued operational autonomy, we also help them to leverage the benefits of AMG’s scale in U.S. retail and global product distribution, operations and technology to enhance their growth and capabilities.”

Collectively, AMG boasts more than $600B in AUM. Time will tell whether its affiliates become controlled outright and re-branded, and more importantly, whether such affiliation ultimately benefits investors. It currently showcases full contact information of its affiliates, and affiliates like Aston showcase contact information of its sub-advisers.

Bottom line
Is Bill Smead correct when he claims separation from Wall Street gives his firm an edge? Does location matter to performance? Whether location influences fund performance remains an interesting question, but as part of your due diligence, there should be no confusion about knowing where your fund adviser (and sub-adviser) works.

Alpha Architect US Quantitative Value (QVAL), December 2014

By Charles Boccadoro

At the time of publication, this fund was named ValueShares US Quantitative Value.

Objective and Strategy

The ValueShares US Quantitative Value (QVAL) strategy seeks long-term capital appreciation by investing in a concentrated portfolio of 40 or so US exchange traded stocks of larger capitalizations, which the adviser determines to be undervalued but possess strong economic moats and financial strength. In a nutshell: QVAL buys “the cheapest, highest quality value stocks.”

The fund attempts to actively capture returns in excess of the so-called “value anomaly” or premium, first identified in 1992 by Professors Fama and French. Basically, stocks with lower valuation (and smaller size) deliver greater than excess returns than the overall market. Using valuation and quality metrics based on empirically vetted academic research, the adviser believes QVAL will deliver positive alpha – higher returns than can be explained by the high-book-to-market value factor.

The adviser implements the QVAL strategy in strictly systematic and quant fashion, because it believes that stock picking based on fundamentals, where value managers try to exploit qualitative signals (e.g., Ben Graham’s cigar butts), is fraught with behavioral biases that “lead to predictable underperformance.”

Adviser

Alpha Architect, LLC maintains the QVAL ETF Trust. Empowered Funds, LLC, which does business as Alpha Architect, is the statutory adviser. Alpha Architect is an SEC-registered investment advisor and asset management firm based in Broomall, Pennsylvania. It offers separately managed accounts (SMAs) for high net worth individuals, family offices, and exchange-traded funds (ETFs). It does not manage hedge funds. There are eight full-time employees, all owner/operators. A ninth employee begins 1 January.

Why Broomall, Pennsylvania? The adviser explains it “is the best value in the area–lowest tax, best prices, good access…the entire team lives 5-10 minutes away and we all hate commuting and have a disdain for flash.” It helps too that it’s close to Drexel University Lebow School of Business and University of Pennsylvania Wharton School of Business, since just about everyone on the team has ties to one or both of these schools. But the real reason, according to two of the managing members: “We both have roots in Colorado, but our wives are both from Philadelphia. We each decided to ‘compromise’ with our wives and settled on Philadelphia.”

Currently, the firm manages about $200M. Based on client needs, the firm employs various strategies, including “quantitative value,” which is the basis for QVAL, and robust asset allocation, which employs uncorrelated (or at least less correlated) asset allocation and trend following like that described in The Ivy Portfolio.

QVAL is the firm’s first ETF.  It is a pure-play, long-only, valued-based strategy. Three other ETFs are pending. IVAL, an international complement to QVAL, expected to launch in the next few weeks.  QMOM will be a pure-play, long-only, momentum-based strategy, launching middle of next year. Finally, IMOM, international complement to QMOM.

ValueShares is the brand name of Alpha Architect’s two value-based ETFs. MomentumShares will be the brand name for its two momentum-based ETFs. The adviser thoroughly appreciates the benefits and pitfalls of each strategy, but mutual appreciation is not shared by each investor camp, hence the separate brand names.

With their active ETF offerings, Alpha Architect is challenging the investment industry as detailed in the recent post “The Alpha Architect Proposition.” The adviser believes that:

  • The investment industry today thrives “on complexity and opaqueness to promote high-priced, low-value add products to confuse investors who are overwhelmed by financial decisions.”
  • “…active managers often overcharge for the expected alpha they deliver. Net of fees/costs/taxes, investors are usually better served via low-cost passive allocations.”
  • “Is it essentially impossible to generate genuine alpha in closet-indexing, low-tracking error strategies that will never get an institutional manager fired.”

Its goal is “to disrupt this calculus…to deliver Affordable Active Alpha for those investors who believe that markets aren’t perfectly efficient.”

The table below depicts how the adviser sees current asset management landscape and the opportunity for its new ETFs. Notice that Active Share, Antti Petajisto’s measure of active portfolio management (ref. “How Active Is Your Fund Manager? A New Measure That Predicts Performance”) is a key tenant. David Snowball started including this metric in MFO fund profiles last March.

qval_1v2

Managers

Wesley Gray, John Vogel and Brandon Koepke. 

Dr. Gray is the founder of Alpha Architect. He earned an BA and a PhD in Finance from the University of Chicago, rose to the rank of captain in the US Marine Corps, and was a finance professor at Drexel University. He is the author of Quantitative Value: A Practitioner’s Guide (2016). Dr. Vogel is a Managing Member of Empowered Funds, LLC and Empiritrage, where he heads the research department.  Dr. Vogel earned a Ph.D. in Finance from Drexel University and served as a research assistant there. Mr. Koepke serves as Chief Technology Officer & Portfolio Manager. Drs. Gray and Vogel has managed the fund since inception, Mr. Koepke joined the team in 2020.

Strategy capacity and closure

As structured currently, QVAL has the capacity for about $1B. The adviser has done a lot of research that shows, from a quant perspective, larger scale would come with attendant drop in expected annualized return “~100-150bps, but gives us capacity to $5-10B.”

Active share

74.5. “Active share” measures the degree to which a fund’s portfolio differs from the holdings of its benchmark portfolio, which for QVAL is S&P500 Total Return index.

In response to our inquiry, the adviser provided an Active Share spread-sheet for several value funds. It shows, for example, Dodge & Cox Fund has an Active Share of 68.7.

MFO has tried to collect and maintain this metric for various funds on our Active Share webpage. Antti Petajisto’s website only provides data through 2009. Morningstar holds the current values close. Only a few fund houses (e.g., FPA) publish them on their fact sheets.

So, we were excited to learn that Alpha Architect is building a tool to compute Active Share for all funds using the most current 13F filings.  The tool will be part of its 100% free (but registration required) DIY Investing webpage.

Management’s Stake in the Fund

Neither Dr. Gray nor Dr. Vogel has a recorded investment in the fund. Mr. Koepke has invested between $10,000 – 50,000 in it.

Opening date

October 22, 2014. In its very short history through November 28, 2014, it has quickly amassed $18.4M in AUM.

Minimum investment

QVAL is an ETF, which means it trades like a stock. At market close on November 28, 2014, the share price was $26.13.

Expense ratio

0.39% with AUM of $222.4 million, as of June 2023. There is no 12b-1 fee.

As of October 2014, a review of US long-only, open-ended mutual funds (OEFs) and ETFs across the nine Morningstar domestic categories (small value to large growth) shows just over 2500 unique offerings, including 269 ETFs, but only 19 ETFs not following an index. Average er of these ETFs not following an index is 0.81%. Average er for index-following ETFs is 0.39%. Average er of the OEFs is 1.13%, with sadly about one third of these charging front-loads of nominally 5.5%. (This continuing practice never ceases to disappoint me.) Average er of OEFs across all share classes in this group is 1.25%.

QVAL appears to be just under the average of its “active” ETF peers, in between a couple other notables: Cambria Shareholder Yield ETF (SYLD) at 0.59% and AdvisorShares TrimTabs Float Shrink ETF (TTFS) at 0.99%.

But there is more…

The adviser informs us that there are “NO SOFT DOLLARS” in the QVAL fee structure.

What’s that mean? The SEC defines soft dollars in its 1998 document “Inspection Report on the Soft Dollar Practices of Broker-Dealers, Investment Advisers and Mutual Funds.”

Advisers that use soft dollars agree to pay higher commissions to broker-dealers to execute its trades in exchange for things like Bloomberg terminals and research databases, things that the adviser could choose to pay out of its own pocket, but rarely does. The higher commissions translate to higher transactions fees that are passed onto investors, effectively increasing er through a “hidden” fee.

“Hidden” outside the er, but disclosed in the fine print. To assess whether your fund’s adviser imposes a “soft dollar” fee, look in its SAI under the section typically entitled “Brokerage Selection” or “Portfolio Transactions and Brokerage.” Here’s how the disclosure reads, something like:

To the extent Adviser obtains brokerage and research services from a broker-dealer that it otherwise would acquire at its own expense, Adviser may have an incentive pay higher commissions than would otherwise be the case.

Here’s how the QVAL SAI reads:

Adviser does not currently use soft dollars.

Comments

Among the many great ideas and anecdotes conveyed in the book Quantitative Value, one is about the crash of the B-17 Flying Fortress during a test flight at Wright Air Field in Dayton, Ohio. The year was 1935. The incident took the life of Army Air Corps’ chief test pilot Major Ployer Hill, a very experienced pilot. Initially, people blamed the plane. That must have failed mechanically, or it was simply too difficult to fly. But the investigation concluded “pilot error” caused the accident. “It turned out the Flying Fortress was not ‘too much airplane for one man to fly,’ it was simply too much airplane for one man to fly from memory.”

In response to the incident, the Army Air Corps successfully instituted checklists, which remain intrinsic to all pilot and test pilot procedures today. The authors of Quantitative Value and the adviser of QVAL believe that the strategy becomes the checklist.

The following diagram depicts the five principal steps in the strategy “checklist” the adviser employs to systematically invest in “the cheapest, highest quality value stocks.” A more detailed description of each step is offered in the post “Our Quantitative Value Philosophy,” which is a much abbreviated version of the book.

qval_2

The book culminates with results showing the qualitative value strategy beating S&P500 handily between 1974 through 2011, delivering much higher annualized returns with lower drawdown and volatility. Over the same period, it also bested Joel Greenblatt’s similar Magic Formula strategy made popular in The Little Book That Beats The Market. Finally, between 1991 and 2011, it outperformed three of the top activity managed funds of the period – Sequoia, Legg Mason Value, and Third Avenue Value. Sequoia, one of the greatest funds ever, is the only one that closely competed based on basic risk/reward metrics.

The quantitative value strategy has evolved over the past 12 years. Wesley states that, “barring some miraculous change in human psychology or a ‘eureka’ moment on the R&D side,” it is pretty much set for the foreseeable future.

Before including QVAL in your portfolio, which is based on the strategy outlined in the book, a couple precautions to consider…

First, it is long only, always fully invested, and does not impose an absolute value constraint.  It takes the “cheapest 10%,” so there will always be stocks in its portfolio even if the overall market is rocketing higher, perhaps irrationally higher. It applies no draw down control. It never moves to cash.

While it may use Ben Graham’s distillation of sound investing, known as “margin of safety,” to good effect, if the overall market tanks, QVAL will likely tank too. An investor should therefore allocate to QVAL based on investment timeline and risk tolerance.

More conservative investors could also use the strategy to create a more market neutral portfolio by going long QVAL and dynamically shorting S&P 500 futures – a DIY hedge fund for a lot less than 2/20 and a lot more tax-efficient. “In this structure you get to spread bet between deep value and the market, which has been a good bet historically,” Wesley explains.

Second, it has no sector diversification constraint. So, if an entire sector heads south, like energy has done lately, the QVAL portfolio will likely be heavy the beaten-down sector. Wesley defends this aspect of the strategy: “Sector diversification simply prevents good ideas (i.e., true value investing) from working. We’ve examined this and this is also what everyone else does. And just because everyone else is doing it, doesn’t mean it is a good idea.”

Bottom Line

The just launched ValueShares US Quantitative Value (QVAL) ETF appears to be an efficient, transparent, well formulated, and systematic vehicle to capture the value premium historically delivered by the US market…and maybe more. Its start-up adviser, Alpha Architect, is a well-capitalized firm with minimalist needs, a research-oriented academic culture, and passionate leadership. It is actually encouraging its many SMA customers to move to ETFs, which have inherently lower cost and no minimums.

If the concept of value investing appeals to you (and it should), if you believe that markets are not always efficient and offer opportunities for active strategies to exploit them, and if you are tired of scratching your head trying to understand ad hoc actions of your current portfolio manager while paying high expenses (you really should be), then QVAL should be on your very short list.

Fund website

The team at Alpha Architect pumps a ton of educational content on its website, which includes white papers, DIY investing tools, and its blog.

Fund Information

[cr2014]

Mediocrity and Frustration

By Charles Boccadoro

Originally published in November 1, 2014 Commentary

I’ve been fully invested in the market for the past 14 years with little to show for it, except frustration and proclamations of even more frustration ahead. During this time, basically since start of 21st century, my portfolio has returned only 3.9% per year, substantially below historical return of the last century, which includes among many other things The Great Depression.

I’ve suffered two monster drawdowns, each halving my balance. I’ve spent 65 months looking at monthly statements showing retractions of at least 20%. And, each time I seem to climb-out, I’m greeted with headlines telling me the next big drop is just around the corner (e.g., “How to Prepare for the Coming Bear Market,” and “Are You Prepared for a Stock Selloff ?“)

I have one Nobel Prize winner telling me the market is still overpriced, seeming every chance he gets. And another telling me that there is nothing I can do about it…that no amount of research will help me improve my portfolio’s performance.

Welcome to US stock market investing in the new century…in the new millennium.

The chart below depicts S&P 500 total return, which includes reinvested dividends, since December 1968, basically during the past 46 years. It uses month-ending returns, so intra-day and intra-month fluctuations are not reflected, as was done in a similar chart presented in Ten Market Cycles. The less frequent perspective discounts, for example, bear sightings from bear markets.

mediocrity_1

The period holds five market cycles, the last still in progress, each cycle comprising a bear and bull market, defined as a 20% move opposite preceding peak or trough, respectively. The last two cycles account for the mediocre annualized returns of 3.9%, across 14-years, or more precisely 169 months through September 2014.

Journalist hyperbole about how “share prices have almost tripled since the March 2009 low” refers to the performance of the current bull market, which indeed accounts for a great 21.9% annualized return over the past 67 months. Somehow this performance gets decoupled from the preceding -51% return of the financial crisis bear. Cycle 4 holds a similar story, only investors had to suffer 40 months of protracted 20% declines during the tech bubble bear before finally eking out a 2% annualized return across its 7-year full cycle.

Despite advances reflected in the current bull run, 14-year annualized returns (plotted against the secondary axis on the chart above) are among the lowest they been for the S&P 500 since September 1944, when returns reflected impacts of The Great Depression and World War II.

Makes you wonder why anybody invests in the stock market.

I suspect all one needs to do is see the significant potential for upside, as witnessed in Cycles 2-3. Our current bull pales in comparison to the truly remarkable advances of the two bull runs of 1970-80s and 1990s. An investment of $10,000 in October 1974, the trough of 1973-74, resulted in a balance of $610,017 by August 2000 – a 6000% return, or 17.2% for nearly 26 years, which includes the brief bear of 1987 and its coincident Black Monday.

Here’s a summary of results presented in the above graph, showing the dramatic differences between the two great bull markets at the end of the last century with the first two of the new century, so far:

mediocrity_2

But how many funds were around to take advantage 40 years ago? Answer: Not many. Here’s a count of today’s funds that also existed at the start of the last five bull markets:

mediocrity_3

Makes you wonder whether the current mediocrity is simply due to too many people and perhaps too much money chasing too few good ideas?

The long-term annualized absolute return for the S&P 500 is 10%, dating back to January 1926 through September 2014, about 89 years (using database derived from Goyal and Shiller websites). But the position held currently by many value oriented investors, money-managers, and CAPE Crusaders is that we will have to suffer mediocre returns for the foreseeable future…at some level to make-up for excessive valuations at the end of the last century. Paying it seems for sins of our fathers.

Of course, high valuation isn’t the only concern expressed about the US stock market. Others believe that the economy will face significant headwinds, making it hard to repeat higher market returns of years past. Rob Arnott describes the “3-D Hurricane Force Headwind” caused by waves of Deficit spending, which artificially props-up GDP, higher than published Debt, and aging Demographics.

Expectations for US stocks for the next ten years is very low, as depicted in the new risk and return tool on Research Affiliates’ website (thanks to Meb Faber for heads-up here). Forecast for large US equities? Just 0.7% total return per year. And small caps? Zero.

Good grief.

What about bonds?

Plotted also on the first chart above is 10-year average T-Bill interest rate. While it has trended down since the early 1980’s, if there is a correlation between it and stock performance, it is not obvious. What is obvious is that since interest rates peaked in 1981, US aggregate bonds have been hands-down superior to US stocks for healthy, stable, risk-adjusted returns, as summarized below:

mediocrity_4

Sure, stocks still triumphed on absolute return, but who would not take 8.7% annually with such low volatility? Based on comparisons of absolute return and Ulcer Index, bonds returned more than 70% of the gain with just 10% of the pain.

With underlining factors like 33 years of declining interest rates, it is no wonder that bond funds proliferated during this period and perhaps why some conservative allocation funds, like the MFO Great Owl and Morningstar Gold Metal Vanguard Wellesley Income Fund (VWINX), performed so well. But will they be as attractive the next 33 years, or when interest rates rise?

As Morningstar’s Kevin McDevitt points out in his assessment of VWINX, “the fund lagged its average peer…from July 1, 1970, through July 1, 1980, a period of generally rising interest rates.” That said, it still captured 85% of the S&P500 return over that period and 76% during the Cycle 2 bull market from October 1974 through August 1987.

Of course, predicting interest rates will rise and interest rates actually rising are two different animals, as evidenced in bond returns YTD. In fact, our colleague Ed Studzinski recently pointed out the long term bonds have done exceptionally well this year (e.g., Vanguard Extended Duration Treasury ETF up 26.3% through September). Who would have figured?

I’m reminded of the pop quiz Greg Ip presents in his opening chapter of “Little Book of Economics”: The year is 1990. Which of the following countries has the brighter future…Japan or US? In 1990, many economists and investors picked Japan. Accurately predicting macroeconomics it seems is very hard to do. Some say it is simply not possible.

Similarly, the difficulty mutual funds have to consistently achieve top-quintile performance, either across fixed time periods or market cycles, or using absolute or risk-adjusted measures, is well documented (e.g., The Persistence Scorecard – June 2014, Persistence is a Killer, In Search of Persistence, and Ten Market Cycles). It does not happen. Due to the many underlying technical and psychological variables of the market place, if not the shear randomness of events.

In his great book “The Most Important Thing,” Howard Marks describes the skillful defensive investor as someone who does not lose much when the market goes down, but gains a fair amount when the market goes up. But this too appears very hard to do consistently.

Vanguard’s Convertible Securities Fund (VCVSX), sub-advised by OakTree Capital Management, appears to exhibit this quality to some degree, typically capturing 70-100% of upside with 70-80% of downside across the last three market cycles.

Since bull markets tend to last much longer than bear markets and produce returns well above the average, capturing a “fair amount” does not need to be that high. Examining funds that have been around for at least 1.5 cycles (since October 2002, oldest share class only), the following delivered 50% or more total return during bull markets, while limiting drawdowns to 50% during bear markets, each relative to S&P 500. Given the 3500 funds evaluated, the final list is pretty short.

mediocrity_5

VWINX is the oldest, along with Lord Abbett Bond-Debenture Fund (LBNDX). Both achieved this result across the last four full cycles. As a check against performance exceeding the 50% threshold during out-of-cycle or partial-cycle periods, all funds on this list achieved the same result over their lifetimes.

For moderately conservative investors, these funds have not been mediocre or frustrating at all, quite the contrary. For those with an appetite for higher returns and possess the attendant temperament and investing horizon, here is a link to similar funds with higher thresholds: MFO Pain-To-Gain Funds.

We can only hope to have it so good going forward.