Category Archives: Charles

Morningstar ETF Conference Notes

By Charles Boccadoro

Originally published in October 1, 2014 Commentary

MStar_Conf_1

The pre-autumnal weather was perfect. Blue skies. Warm days. Cool nights. Vibrant city scene. New construction. Breath-taking architecture. Diverse eateries, like Lou Malnati’s deep dish pizza. Stylist bars and coffee shops. Colorful flower boxes on The River Walk. Shopping galore. An enlightened public metro system that enables you to arrival at O’Hare and 45 minutes later be at Clark/Lake in the heart of downtown. If you have not visited The Windy City since say when the Sears Tower was renamed the Willis Tower, you owe yourself a walk down The Magnificent Mile.

MStar_Conf_2

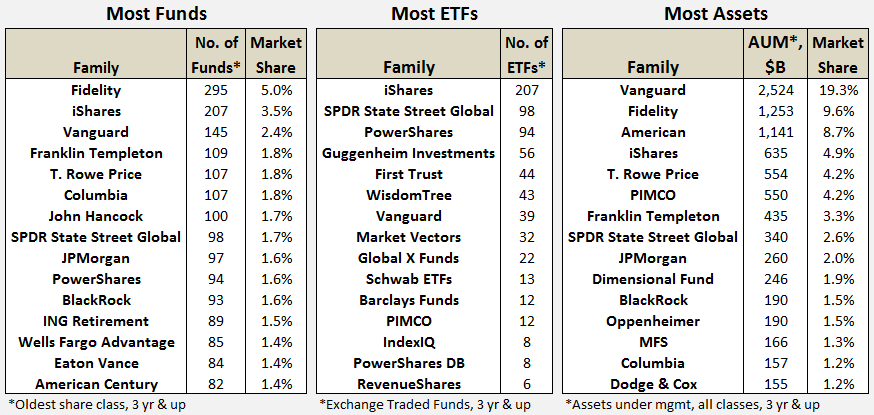
At the opening keynote, Ben Johnson, Morningstar’s director responsible for coverage of exchange traded funds (ETFs) and conference host, noted that ETFs today hold $1.9T in assets versus just $700M only five years ago, during the first such conference. He explained that 72% is new money, not just appreciation.

The conference had a total of 671 attendees, including 470 registered attendees (mostly financial advisors, but this number also includes PR people and individual attendees), 123 sponsor attendees, 43 speakers, and 35 journalists, but not counting a very helpful M* staff and walk-ins. Five years ago? Just shy of 300 attendees.


The Dirty Words of Finance

AQR’s Ronen Israel spoke of Style Premia, which refers to source of compelling returns generated by certain investment vehicle styles, specifically Value, Momentum, Carry (the tendency for higher-yielding assets to provide higher returns than lower-yielding assets), and Defensive (the tendency for lower-risk and higher-quality assets to generate higher risk-adjusted returns). He argues that these excess returns are backed by both theory, be it efficient market or behavioral science, and “decades of data across geographies and asset groups.”

He presented further data that indicate these four styles have historically had low correlation. He believes that by constructing a portfolio using these styles across multiple asset classes investors will yield more consistent returns versus say the tradition 60/40 stocks/bond balanced portfolio. Add in LSD, which stands for leverage, shorting and derivatives, or what Mr. Israel jokingly calls “the dirty word of finance,” and you have the basic recipe for one of AQR’s newest fund offerings: Style Premia Alternative (QSPNX). The fund seeks long-term absolute (positive) returns.

Shorting is used to neutralize market risk, while exposing the Style Premia. Leverage is used to amplify absolute returns at defined portfolio volatility. Derivatives provide most efficient vehicles for exposure to alternative classes, like interest rates, currencies, and commodities.

When asked if using LSD flirted with disaster, Mr. Israel answered it could be managed, alluding to drawdown controls, liquidity, and transparency.

(My own experience with a somewhat similar strategy at AQR, known as Risk Parity, proved to be highly correlated and anything but transparent. When bonds, commodities, and EM equities sank rapidly from May through June 2013, AQR’s strategy sank with them. Its risk parity flagship AQRNX drew down 18.1% in 31 trading days…and the fund house stopped publishing its monthly commentary.)

When asked about the size style, he explained that their research showed size not to be that robust, unless you factored in liquidity and quality, alluding to a future paper called “Size Matters If You Control Your Junk.”

When asked if his presentation was available on-line or in-print, he answered no. His good paper “Understanding Style Premia” was available in the media room and is available at Institutional Investor Journals, registration required.

Launched in October 2013, the young fund has generated nearly $300M in AUM while slightly underperforming Vanguard’s Balanced Index Fund VBINX, but outperforming the rather diverse multi-alternative category.

QSPNX er is 2.36% after waivers and 1.75% after cap (through April 2015). Like all AQR funds, it carries high minimums and caters to the exclusivity of institutional investors and advisors, which strikes me as being shareholder unfriendly. Today, AQR offers 27 funds, 17 launched in the past three years. They offer no ETFs.

MStar_Conf_3


In The Shadow of Giants

PIMCO’s Jerome Schneider took over the short-term and funding desk from legendary Paul McCulley in 2010. Two years before, he was at Bear Stearns. Today, think popular active ETF MINT. Think PAIUX.

During his briefing, he touched on 2% being real expected growth rate. Of new liquidly requirements for money market funds, which could bring potential for redemption gates and fees, providing more motivation to look at low duration bonds as an alternative to cash. He spoke of 14 year old cars that needed to be replaced and expected US housing recovery.

He anticipates capital expenditure will continue to improve, people will get wealthier, and for US to provide a better investment outlook than rest of world, which was a somewhat contrarian view at the conference. He mentioned global debt overhang, mostly in the public sector. Of working age population declining. And, of geopolitical instability. He believes bonds still play a role in one’s portfolio, because historically they have drawn down much less than equities.

It was all rather disjointed.

Mostly, he talked about the extraordinary culture of active management at PIMCO. With time tested investment practices. Liquidity sensitivity. Risk management. Credit research capability, including 45 analysts across the globe that he begins calling at 03:45…the start of his work day. He touted PIMCO’s understanding of tools of the trade and trading acumen. “Even Bill Gross still trades.” He displayed a picture of himself that folks often mistook for a young Paul McCulley.

Cannot help but think what an awkward time it must be for the good folks at PIMCO. And be reminded of another giant’s quote: “Only when the tide goes out do you discover who’s been swimming naked.”


MStar_Conf_4
Youthful Hosts

Surely, it is my own graying hair, wrinkled bags, muddled thought processes, and inarticulate mannerisms that makes me notice something extraordinary about the people hosting and leading the conference’s many panels, workshops, luncheons, keynotes, receptions, and sidebars. They all look very young! In addition to being clear thinkers, articulate public speakers, helpful and gracious hosts.

It would not be too much of a stretch to say that the combined ages of M*’s Ben Johnson, Ling-Wei Hew, and Samuel Lee together add up to one Eugene Fama.  Indeed, when Mr. Johnson sat across from Nobel laureate Professor Fama, during a charming lunch time keynote/interview, he could have easily been an undergraduate from University of Chicago.

Is it because the ETF industry itself is young? Or, is it as a colleague explains: “Morningstar has hard time holding on to good talent because it is a stepping stone to higher paying jobs at places like BlackRock.”

Whatever the reason, if we were all as knowledgeable about investing as Mr. Lee and the rest of the youthful staff, the world of investing would be a much better place.


Damp & Disappointing

That’s how JP Morgan’s Dr. David Kelly, Chief Global Strategist, describes our current recovery. While I did not agree with everything, it was hands-down the best talk of the conference. At one point he said that he wished he could speak for another hour. I wished he could have too.

“Damp and disappointing, like an Irish summer,” he explained.

Short term US prospects are good, but long term not good. “In the short run, it’s all about demand. But in the long run, it’s all about supply, which will be adversely impacted by labor and productivity.” The labor force is not growing. Baby boomers are retiring en masse. He also showed data that productivity was likely not growing, blaming lack of capital expenditure. (Hard to believe since we seem to work 24/7 these days thanks to amazing improvements communications, computing, information access, manufacturing technology, etc. All the while, living longer.)

Dr. Kelly offered up fixes: 1) corporate tax reform, including 10% flat rate, and 2) immigration reform, that allows the world’s best, brightest, and hardest working continued entry to the US. But since congress only acts in crisis, he concedes his forecast prepares for slowing US growth longer term.

Greater opportunity for long term growth is overseas. Manufacturing momentum is gaining around world. Cyclical growth will be higher than US while valuations remain lower and work force is younger. Simply put, they have more room to grow. Unfortunately, US media bias “always gives impression that the rest of the world is in flames…it shows only bad news.”

JP Morgan remains underweight fixed income, since monetary policy remains abnormal, and cautiously over weight US equities. The thing about Irish summers is…everything is green. Low interest rates. Higher corporate margins. Normal valuation. Although he takes issue with the phrase “All the easy money has been made in equities.” He asks “When was it ever easy?”

MStar_Conf_5


Alpha Architect

Dr. Wesley Gray is a former US Marine Captain, a former assistant and now adjunct professor at Drexel University, co-author of Quantitative Value: A Practitioner’s Guide to Automating Intelligent Investment and Eliminating Behavioral Errors, and founder of AlphaArchitect, LLC.

He earned his MBA and Finance PhD from University of Chicago, where Professor Fama was on his doctoral committee. He offers a fresh perspective in the investment community. Straight talking and no holds barred. My first impression – a kind of amped-up, in-your-face Mebane Faber. (They are friends.)

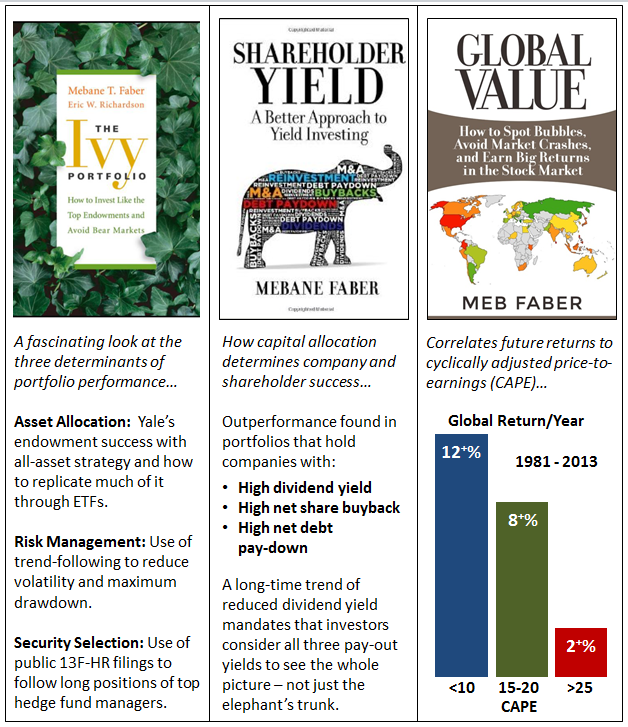
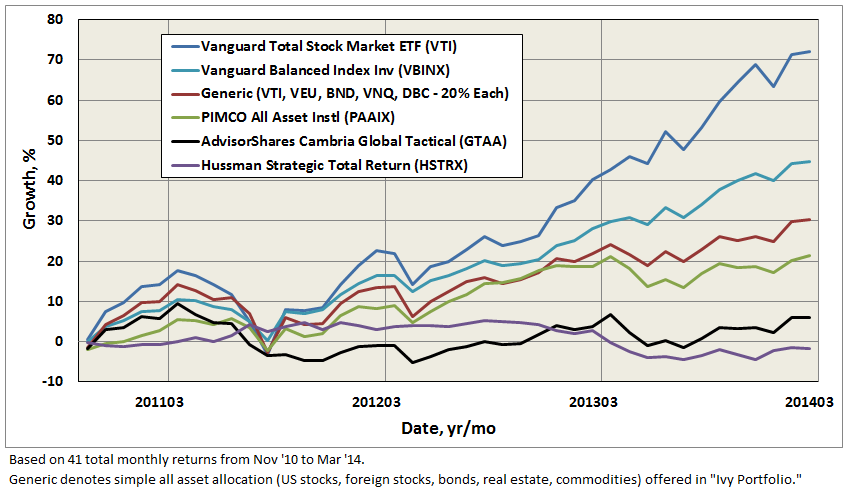
In fact, he starts his presentation with an overview of Mr. Faber’s book “The Ivy Portfolio,” which at its simplest form represents an equal allocation strategy across multiple and somewhat uncorrelated investment vehicles, like US stocks, world stocks, bonds, REITS, and commodities.

Dr. Gray argues that simple, equal allocation remains tough to beat. No model works all the time; in fact, the simple equal allocation strategy has under-performed the past four years, but precisely because forces driving markets are unstable, the strategy will reward investors with satisfactory returns over the long run. “Complexity does not add value.”

He seems equally comfortable talking efficient market theory and how to maximize a portfolio’s Sharpe ratio as he does explaining why the phycology of dynamic loss aversion creates opportunities in the market.

When Professor Fama earlier in the day dismissed a question about trend-following, answering “No evidence that this works,” Dr. Gray wished he would have asked about the so-called “Prime anomaly…momentum. Momentum is pervasive.”

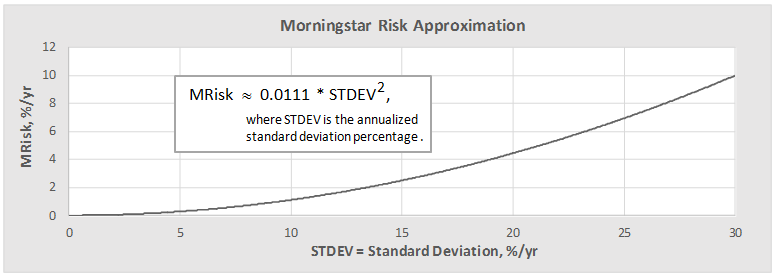
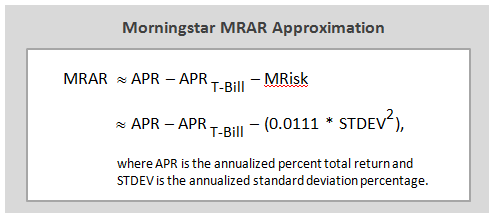
When Dr. Gray was asked, “Will your presentation would be made available on-line?” He answered “Absolutely.” Here is link to Beware of Geeks Bearing Formulas.

His firm’s web site is interesting, including a new tools page, free with an easy registration. They launch their first ETF aptly called Alpha Architect’s Quantitative Value (QVAL) on 20 October, which will follow the strategy outlined in the book. Basically, buy cheap high-quality stocks that Wall Street hates using systematic decision making in a transparent fashion. Definitively a candidate MFO fund profile.


Trends Shaping The ETF Market

Ben Johnson hosted an excellent overview ETF trends. The overall briefings included Strategic Beta, Active ETFs (like BOND and MINT), and ETF Managed Portfolios.

Points made by Mr. Johnson:

1. Active vs passive is a false premise. Today’s ETFs represent a cross-section of both approaches.

2. “More assets are flowing into passive investment vehicles that are increasingly active in their nature and implementation.”

3. Smart beta is a loaded term. “They will not look smart all the time” and investors need to set expectations accordingly.

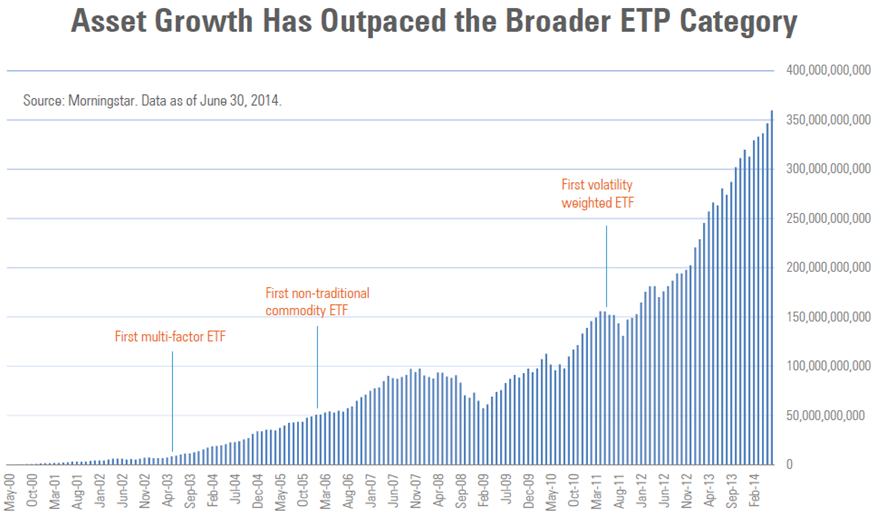
4. M* assigns the term “Strategic Beta” to a growing category of indexes and exchange traded products (ETPs) that track them. “These indexes seek to enhance returns or minimize risk relative to traditional market cap weighted benchmarks.” They often have tilts, like low volatility value, and are consistently rules-based, transparent, and relatively low-cost.

MStar_Conf_6

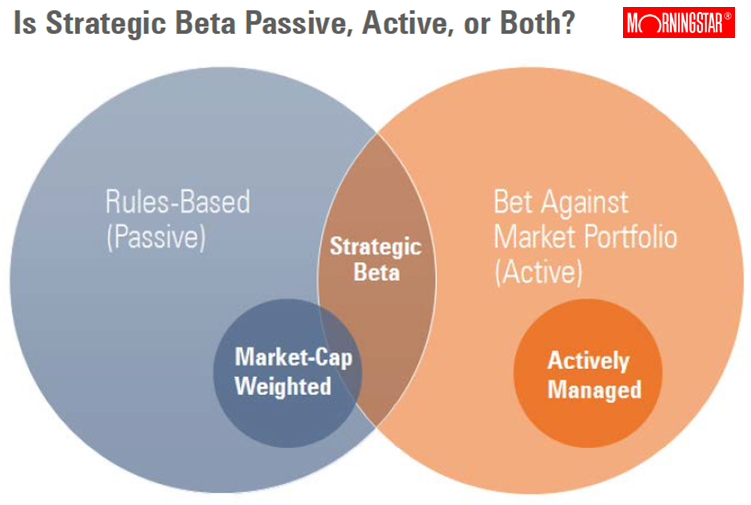
5. Strategic Beta subset of ETPs has been explosive in recent years with 374 listed in US as of 2Q14 or 1/4 of all ETPs, while amassing $360M, or 1/5th of ETP AUM. Perhaps more telling is that 31% of new cash flows for ETPs in 2013 went into Strategic Beta products.

MStar_Conf_7

6. Reduction or fees and a general disillusionment with active managers are two of several reasons behind the growth in these ETFs.  These quasi active funds charge a fraction of traditional fees. A disillusionment with active managers is evidenced in recent surveys made by Northern Trust and PowerShares.

M* is attempting to bring more neutral attention to these ETFs, which up to now has been driven by product providers. In doing so, M* hopes to help set expectation management, or ground rules if you will, to better compare these investment alternatives. With ground rules set, they seek to highlight winners and call out losers. And, at the end of the day, help investors “navigate this increasingly complex landscape.”

They’ve started to develop the following taxonomy that is complementary to (but not in place of) existing M* categories.

MStar_Conf_8

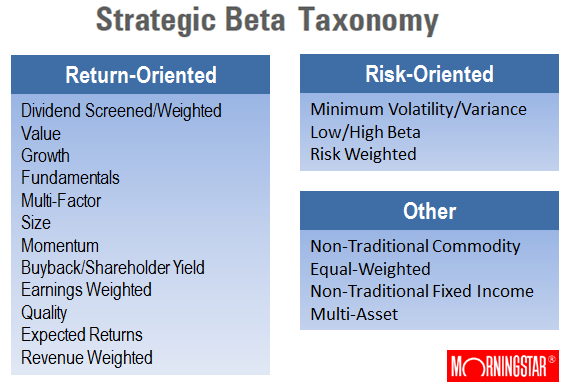
Honestly, I think their coverage of this area is M* at its best.


Welcomed Moderation

Mr. Koesterich gave the conference opening keynote. He is chief investment strategist for BlackRock. The briefing room was packed. Several hundred people. Many standing along wall. The reception afterward was just madness. His briefing was entitled “2014 Mid-Year Update – What to Know / What to Do.”

He threaded a somewhat cautiously reassuring middle ground. Things aren’t great. But, they aren’t terrible either. They are just different. Different, perhaps, because the fed experiment is untested. No one really knows how QE will turn out. But in mean time, it’s keeping things together.

Different, perhaps, because this is first time in 30-some years where investors are facing a rising interest rate environment. Not expected to be rapid. But rather certain. So bonds no longer seem as safe and certainly not as high yield as in recent decades.

To get to the punch-line, his advice is: 1) rethink bonds – seek adaptive strategies, look to EM, switch to terms less interest rate sensitive, like HY, avoiding 2-5 year maturities, look into muni’s on taxable accounts, 2) generate income, but don’t overreach – look for flexible approaches, proxies to HY, like dividend equities, and 3) seek growth, but manage volatility – diversify to unconstrained strategies

More generally, he thinks we are in a cyclical upswing, but slower than normal. Does not expect US to achieve 3.5% annual GDP growth (post WWII normal) for next decade. Reasons: high debt, aging demographics, and wage stagnation (similar to Rob Arnott’s 3D cautions).

He cited stats that non-financial debt has actually increased 20-30%, not decreased, since financial crisis. US population growth last year was zero. Overall wages, adjusted for inflation, same as late ’90s. But for men, same as mid ‘70s. (The latter wage impact has been masked by more credit availability, more women working, and lower savings.) All indicative of slower growth in US for foreseeable future, despite increases in productivity.

Lack of volatility is due to fed, keeping interest rates low, and high liquidity. Expects volatility to increase next year as rates start to rise. He believes that lower interest rates so far is one of year’s biggest surprises. Explains it due to pension funds shifting out of equities and into bonds and that US 10 year is pretty good relative to Japan and Europe.

On inflation, he believes tech and aging demographics tend to keep inflation in check.

BlackRock continues to like large cap over small cap. Latter will be more sensitive to interest rate increases.

Anything cheap? Stocks remain cheaper than bonds, because of extensive fed purchases during QE. Nothing cheap on absolute basis, only on relative basis. “All asset classes above long term averages, except a couple niche areas.”

“Should we all move to cash?” Mr. Koesterich answers no. Just moderate our expectations going forward. Equities are perhaps 10-15% above long term averages. But not expensive compared to prices before previous drops.

One reason is company margins remain high. For couple of same reasons: low credit interest and low wages. Plus higher productivity, which later appeared contrary to JP Morgan’s perspective.

He advises investors be selective in equities. Look for value. Like large over small. More cyclical companies. He likes tech, energy, manufacturing, financials going forward. This past year, folks have driven up valuations of “safe” equities like utilities, staples, REITS. But those investments tend to work well in recessions…not so much in rising interest rate environment. EM relatively inexpensive, but fears they are cheap for reason. Lots of divided arguments here at BlackRock. Japan likely good trade for next couple years due to Japanese pension funds shifting to organic assets.

He closed by stating that only New Zealand is offering a 10 year sovereign return above 4%. Which means, bond holders must take on higher risk. He suggests three places to look: HY, EM, muni’s.

Again, a moderate presentation and perhaps not much new here. While I personally remain more cautiously optimistic about US economy, compared to mounting predictions of another big pull-back, it was a welcomed perspective.

MStar_Conf_9


Beta Central

I’m hard-pressed to think of someone who has done more to enlighten investors about the benefits of ETF vehicles and opportunities beyond buy-and-hold US market cap than Mebane Faber. At this conference especially, he represents a central figure helping shape investment opportunities and strategies today.

He was kind enough to spend a few minutes before his panel on dividend investing and ETFs, which he held with Morningstar’s Josh Peters and Samuel Lee.

He shared that Cambria recently completed a funding campaign to expand its internal operations using the increasingly popular “Crowd Funding” approach. They did not use one of the established shops, like EquityNet, simply because of cost.  A couple hundred “accredited investors” quickly responded to Cambria’s request to raise $1-2M. The investors now have a private stake in the company. Mebane says they plan to use the funds to increase staff, both research and marketing. Indeed, he’s hiring: “If you are an A+ candidate, incredibly sharp, gritty, and super hungry, come join us!”

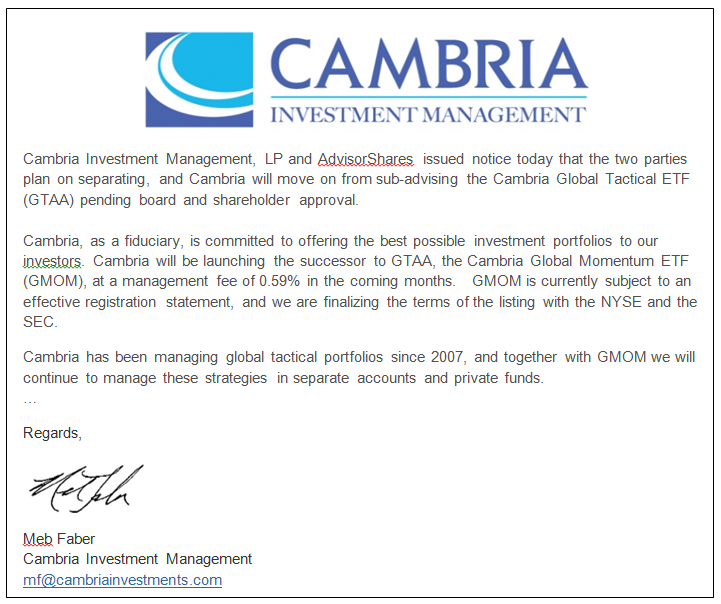
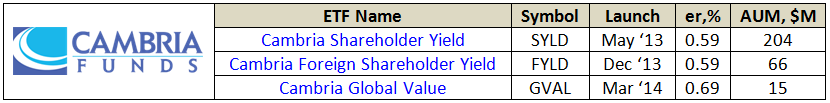
The new ETF Global Momentum (GMOM), which we mentioned in the July commentary, is due out soon, he thinks this month. Several others are in pipeline: Global Income and Currency Strategies ETF (FXFX), Emerging Shareholder Yield ETF (EYLD), Sovereign High Yield Bond ETF (SOVB), and Value and Momentum ETF (VAMO), which will make for a total of eight Cambria ETFs. The initial three ETFs (SYLD, FYLD, and GVAL) have attracted $365M in their young lives.

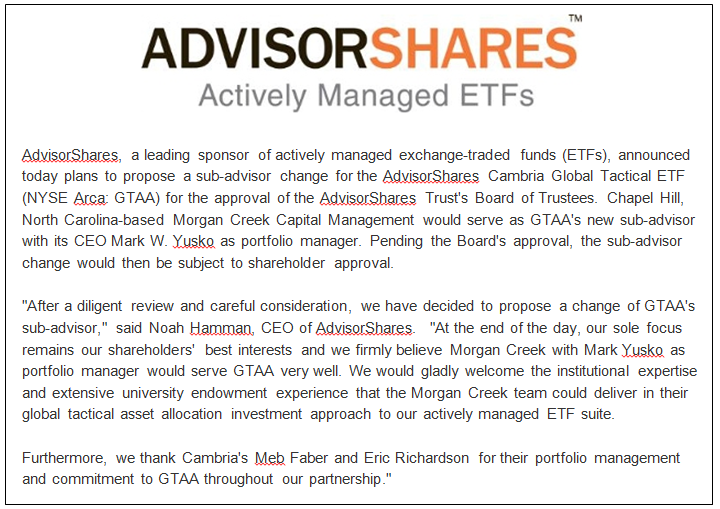
He admitted being surprised that Mark Yusko of Morgan Creek Funds agreed to take over AdvisorShares Global Tactical ETF GTAA, which now has just $20M AUM.

He was also surprised and disappointed to read about the SEC’s probe in F2 Investments, which alleges overstated performance results. F2 specializes in strategies “designed to protect investors from severe losses in down markets while providing quality participation in rising markets” and they sub-advise several Virtus ETFs. When WSJ reported that F2 received a so-called Wells notice, which portends a civil case against the company, Mebane posted “first requirement for anyone allocating to separate account investment advisor – GIPS audit. None? Move on.” I asked, “What’s GIPS?” He explains it stands for Global Investment Performance Standards and was created by the CFA Institute.

Mebane continues to write, has three books in work, including one on top hedge funds. Speaking of insight into hedge funds, subscribers joining his The Idea Farm after 31 December will pay a much elevated $499 annually.

Why Am I Rebalancing?

By Charles Boccadoro

Originally published in September 1, 2014 Commentary

Long-time MFO discussion board member AKAFlack emailed me recently wondering how much investors have underperformed during the current bull market due to the practice of rebalancing their portfolios.

For those that rebalance annually, the answer is…almost 12% in total return from March 2009 through June 2014. Not huge given the healthy gains, but certainly noticeable. The graph below compares performance for a buy & hold and an annually rebalanced portfolio, assuming an initial investment of $10,000 allocated 60% to stocks and 40% to bonds.

rebalancing_1

So why rebalance?

According to a good study by Vanguard, entitled “Best practices for portfolio rebalancing,” the answer is not to maximize return. “If the sole objective is to maximize return regardless of risk, then the investor should select a 100% equity portfolio.”

The purpose of rebalancing, whether done periodically or by threshold deviation, is to keep a portfolio risk composition consistent with an investor’s tolerance, as defined by their target allocation. Otherwise, investors “can end up with a portfolio that is over-weighted to equities and therefore more vulnerable to equity-market corrections, putting the investors’ portfolios at risk of larger losses compared with their target portfolios.” This situation is evidenced in the allocation shown above for the buy & hold portfolio, which is now at nearly 80/20 stocks/bonds.

In this way, rebalancing is one way to keep loss aversion in check and the attendant consequences of selling and buying at all the wrong times, often chronicled in Morningstar’s notorious “Investor Return” tracking metric.

Balancing makes up ground, however, when equities are temporarily undervalued, like was the case in 2008. The same comparison as above but now across the most current full market cycle, beginning in November 2007, shows that annual balancing actually slighted outperformed the buy & hold portfolio.

rebalancing_2

In his book “The Ivy Portfolio,” Mebane Faber presents additional data to support that “there is a clear advantage to rebalancing sometime rather than letting the portfolio drift. A simple rebalance can add 0.1 to 0.2 to the Sharpe Ratio.”

If your first investment priority is risk management, occasional rebalancing to your target allocation is one way to help you sleep better at night, even if it means underperforming somewhat during bull markets.

Recovery Time

By Charles Boccadoro

Originally published in August 1, 2014 Commentary

In the book “Practical Risk-Adjusted Performance Measurement,” Carl Bacon defines recovery time or drawdown duration as the time taken to recover from an individual or maximum drawdown to the original level. In the case of maximum drawdown (MAXDD), the figure below depicts recovery time from peak. Typically, for equity funds at least, the descent from peak to valley happens more quickly than the ascent from valley to recovery level.

maxdur1

An individual’s risk tolerance and investment timeline certainly factor into expectations of maximum drawdown and recovery time. As evidenced in “Ten Market Cycles” from our April commentary, 20% drawdowns are quite common. Since 1956, the SP500 has fallen nearly 30% or more eight times. And, three times – a gut wrenching 50%. Morningstar advises that investors in equity funds need “investment horizons longer than 10 years.”

Since 1962, SP500’s worst recovery time is actually a modest 53 months. Perhaps more surprising is that aggregate bonds experienced a similar duration, before the long bull run.  The difference, however, is in the drawdown level itself.

maxdur2

 During the past 20 years, bonds have recovered much more quickly, even after the financial crisis.

maxdur3

Long time MFO board contributor Bee posted recently:

MAXDD or Maximum Drawdown is to me only half of the story.

Markets move up and down. Typically the more aggressive the fund the more likely it is to have a higher MAXDD. I get that. What I find “knocks me out of a fund” in a down market is the fund’s inability to bounce back.

Ulcer Index, as defined by Peter Martin and central to MFO’s ratings system, does capture both the MAXDD and recovery time, but like most indices, it is most easily interpreted when comparing funds over same time period. Shorter recovery times will have lower UIcer Index, even if they experience the same absolute MAXDD. Similarly, the attendant risk-adjusted-return measure Martin Ratio, which is excess return divided by Ulcer Index, will show higher levels.

But nothing hits home quite like maximum drawdown and recovery time, whose absolute levels are easily understood. A review of lifetime MAXDD and recoveries reveals the following funds with some dreadful numbers, representing a cautionary tale at least:

maxdur4

In contrast, some notable funds, including three Great Owls, with recovery times at 1 year or less:

maxdur5

On Bee’s suggestion, we will be working to make fund recovery times available to MFO readers.

Update – Meb Faber gets it right in interesting ways

By Charles Boccadoro

Originally published in July 1, 2014 Commentary

A quick follow-up to our feature on Mebane Faber in the May commentary, entitled “The Existential Pleasure of Engineering Beta.”

On May 16, Mebane posted on his blog “Skin in the Game – My Portfolio,” which states that he invests 100% of his liquid net worth in his firm’s funds: Global Tactical Hedge Fund (private), Global Value ETF (GVAL), Shareholder Yield ETF (SYLD), Foreign Shareholder Yield ETF (FYLD) – all offered by Cambria Investment Management.

His disclosure meets the “Southeastern Asset Management” rule, as coined and proposed by our colleague Ed Studzinski. It would essentially mandate that all employees of an investment firm limit their investments to funds offered by the firm. Ed proposes such a rule to better attune “investment professionals to what should be their real concern – managing risk with a view towards the potential downside, rather than ignoring risk with other people’s money.”

While Mr. Faber did not specify the dollar amount, he did describe it as “certainly meaningful.” The AdvisorShares SAI dated December 30, 2013, indicated he had upwards of $1M invested in his first ETF, Global Tactical ETF (GTAA), which was one of largest amounts among sub-advisors and portfolio managers at AdvisorShares.

Then, on June 5th, more clarity: “The two parties plan on separating, and Cambria will move on” from sub-advising GTAA and launch its own successor Global Momentum ETF (GMOM) at a full 1% lower expense ratio. Here’s the actual announcement:

2014-06-30_1838

Same day, AdvisorShares announced: “After a diligent review and careful consideration, we have decided to propose a change of GTAA’s sub-advisor. At the end of the day, our sole focus remains our shareholders’ best interests…” The updated SAI indicates the planned split is to be effective end of July.

2014-06-30_1841

Given the success of Cambria’s own recently launched ETFs, which together represent AUM of $357M or more than 10 times GTAA, the split is not surprising. What’s surprising is that AdvisorShares is not just shuttering GTAA, but chose instead to propose a new sub-advisor, Mark Yusko of Morgan Creek Capital Management.

On the surface, Mr. Yusko and Mr. Faber could not be more different. The former writes 25 page quarterly commentaries without including a single data graph or table. The latter is more likely to give us 25 charts and tables without a single paragraph.

When Mebane does write, it is casual, direct, and easily understood, while Mr. Yusko seems to read from the corporate play book: “We really want to think differently. We really want to embrace alternative strategies. Not alternative investments but alternative strategies. To gain access to the best and brightest. To invest on that global basis. To take advantage of where we see biggest return opportunities around the world.”

When we asked Mebane for a recent photo to use in the May feature, he did not have one and sent us a self-photo taken with his cell phone. In contrast, Mark Yusko offers a professionally produced video introducing himself and his firm, accompanied with scenes of a lovely creek (presumably Morgan’s) and soft music.   

Interestingly, Morgan Creek launched its first retail fund last September, aptly named Morgan Creek Tactical Allocation Fund (MAGTX/MIGTX). MAGTX carries a 5.75% front-load with a 2% er. (Gulp.) But, the good news is institutional share class MIGTX waives load on $1M minimum and charges only 1.75% er.

Mr. Yusko says “I don’t mind paying [egregious] fees as long as my net return is really high.” While Mr. Faber made a point during the recent Wine Country Conference that a goal for Cambria is to “disrupt the traditional high fee mutual fund and hedge fund business, mostly through launching ETFs.”

The irony here is that GTAA was founded on the tenants described in Mebane’s first book “The Ivy Portfolio,” which includes attempting to replicate Yale’s endowment success with all-asset strategy using an ETF.

Mr. Yusko’s earned his reputation managing the endowments at Notre Dame and University of North Carolina, helping to transform them from traditional stock/bond/cash portfolios to alternative hedge fund/venture capital/private investment portfolios. But WSJ reports that he was asked to step-down last year as CIO of the $3.5B Endowment Fund, which also attempted to mimic endowments like Yale’s. He actually established the fund in partnership with Salient Partners LP in 2004. “After nearly a decade of working with our joint venture partner in Texas, we found ourselves differing on material aspects of how to best run an endowment portfolio and run the business…” Perhaps with AdvisorShares, Mark Yusko will once again be able to see eye-to-eye.

As for Mebane? We will look forward with interest to the launch of GMOM, his continued insights and investment advice shared generously, and wish him luck in his attempts to disrupt the status quo. 

30Jun14/Charles

How Good Is Your Fund Family?

By Charles Boccadoro

family_1Originally published in June 1, 2014 Commentary

Question: How many funds at Dodge & Cox beat their category average returns since inception?

Answer: All of them.

In the case of Dodge & Cox, “all” is five funds:  DODBX, DODFX, DODGX, DODIX, and DODWX. Since inception, or at least as far back as January 1962, through March 2014, each has beaten its category average.

Same is true for these families: First Eagle, Causeway, Marsico, and Westwood.

For purposes of this article, a “fund family” comprises five funds or more, oldest share class only, with each fund being three years or older.

Obviously, no single metric should be used or misused to select a fund. In this case, fund lifetimes are different. Funds can perform inconsistently across market cycles. Share class representing “oldest” can be different. Survivorship bias and category drift can distort findings. Funds can be mis-categorized or just hard to categorize, making comparisons less meaningful.

Finally, metrics based on historical performance may say nothing of future returns, which is why analysis houses (e.g., Morningstar) examine additional factors, like shareholder friendliness, experience, and strategy to identify “funds with the highest potential of success.”

In the case of Marsico, for example, its six funds have struggled recently. The family charges above average expense ratios, and it has lost some experienced fund managers and analysts. While Morningstar acknowledges strong fund performance within this family since inception, it gives Marsico a negative “Parent” rating.

Nonetheless, these disclaimers acknowledged, prudent investors should know, as part of their due diligence, how well a fund family has performed over the long haul.

So, question: How many funds at Pacific Life beat category average returns since inception?

Applying the same criteria as above, the sad truth is: None of them.

PL funds are managed by Pacific Life Fund Advisors LLC, a wholly owned subsidiary of Pacific Life Insurance Company of Newport Beach, CA. Here from their web-site:

family_2

Got that?

Same sad truth for these families: AdvisorOne, Praxis, Integrity, Oak Associates, Arrow Funds, Pacific Financial, and STAAR.

In the case of Oak Associates, its seven funds have underperformed against their categories by 2.4% every year for almost 15 years! (They also experience maximum drawdown of -70.0% on average, or 13.1% worse than their categories.) Yet it proudly advertises recent ranking recognition by US News and selection to Charles Schwab’s OneSource. Its motto: “A Focus on Growth.”

To be clear, my colleague Professor Snowball has written often about the difficulties of beating benchmark indices for those funds that actually try. The headwinds include expense ratios, loads, transaction fees, commissions, and redemption demands. But the lifetime over- and under-performance noted above are against category averages of total returns, which already reflect these headwinds.

Overview. Before presenting performance results for all fund families, here’s is an overall summary, which will put some of the subsequent metrics in context:

family_3

It remains discouraging to see half the families still impose front load, at least for some share classes – an indefensible and ultimately shareholder unfriendly practice. Three quarters of families still charge shareholders a 12b-1 fee. All told shareholders pay fund families $12.3 billion every year for marketing. As David likes to point out, there are more funds in the US today than there are publically traded US companies. Somebody must pay to get the word out.

Size. Fidelity has the most number of funds. iShares has the most ETFs. But Vanguard has the largest assets under management.

family_4

Expense. In last month’s MFO commentary, Edward Studzinski asked: “It Costs How Much?

As a group, fund families charge shareholders $83.3 billion each year for management fees and operating costs, which fall under the heading “expense ratio.” ER includes marketing fees, but excludes transaction fees, loads, and redemption fees.

family_5

It turns out that no fund family with an average ER above 1.58% ranks in the top performance quintile, as defined below, and most families with an average ER above 2.00 end up in the bottom quintile.

While share class does not get written about very often, it helps reveal inequitable treatment of shareholders for investing in the same fund. Typically, different share classes charge different ERs depending on initial investment amount, load or transaction fee, or association of some form. American has the largest number of share classes per fund with nearly five times the industry average.

Rankings. The following tables summarize top and bottom performing families, based on the percentage of their funds with total returns that beat category averages since inception:

family_6

family_7

As MFO readers would expect, comparison of top and bottom quintiles reveals the following tendencies:

  • Top families charge lower ER, 1.06 versus 1.45%, on average
  • Fewer families in top quintile impose front loads, 21 versus 55%
  • Fewer families in top quintile impose 12b-1 fees, 64 versus 88%

For this sample at least, the data also suggests:

  • Top families have longer tenured managers, if slightly, 9.6 versus 8.2 years
  • Top families have fewer share classes, if slightly (1.9 versus 2.3 share class ratio, after 6 sigma American is removed as an outlier; otherwise, just 2.2 versus 2.3)

The complete set of metrics, including ER, AUM, age, tenure, and rankings for each fund family, can be found in MFO Fund Family Metrics, a downloadable Google spreadsheet. (All metrics were derived from Morningstar database found in Steel Mutual Fund Expert, dated March 2014.)

A closer look at the complete fund family data also reveals the following:

family_8

Some fund families, like Oakmark and Artisan, have beaten their category averages by 3-4% every year for more than 10 years running, which seems quite extraordinary. Whether attributed to alpha, beta, process, people, stewardship, or luck…or all the above. Quite extraordinary.

While others, frankly too many others, have done just the opposite. Honestly, it’s probably not too hard to figure out why.

31May14/Charles

The Existential Pleasures of Engineering Beta

By Charles Boccadoro

Originally published in May 1, 2014 Commentary

Mebane Faber is a quant.MF_1

He is a student of financial markets, investor behavior, trend-following, and market bubbles. He pursues absolute return, value, and momentum strategies. And, he likes companies that deliver cash to shareholders.

He recognizes alpha is elusive, so instead focuses on engineering beta, which promises a more pragmatic and enduring reward.

In a field full of business majors and MBAs, he holds degrees in engineering and biology.

He distills a wealth of financial literature, research, and conditions into concise and actionable investing advice, shared through books, his blog, and lectures.

Given low-cost ETFs and mutual funds available today, he thinks people generally should no longer need to hire advisors, or “brokers back in the day,” at 1-2% fees to tell them how to allocate buy-and-hold portfolios. “It kind of borderlines on criminal,” he tells Michael Covel in a recent interview, since such advisors “do not do enough to justify their fees.”

He is a portfolio manager and CIO of Cambria Investment Management, L.P., which he co-founded along with Eric Richardson in 2006. It is located in El Segundo, CA.

His down-to-earth demeanor is at once confident and refreshingly approachable. He cites philosopher Henry David Thoreau: “There is no more fatal blunderer than he who consumes the greater part of his life getting his living.”

The Paper. Mebane (pronounced “meb-inn”) started his career as biotech equity analyst during the genome revolution and internet bubble. While at University of Virginia, he attended an advanced seminar in security analysis taught by the renowned hedge fund manager John Griffin of Blue Ridge Capital. In fulfillment of the Chartered Market Technician program, Mebane drafted a paper that became the basis for “A Quantitative Approach To Tactical Asset Allocation,” published in the Journal of Wealth Management in 2007.

The paper originally included the words “market timing,” but he soon discovered that to a lot of people, the phrase comes with “enormous emotional baggage” and “can immediately shut-down all synapses in their brains.” Similar to Ed Thorp’s experience with his first academic paper on winning at blackjack, Mebane had to change the title to get it published. (It continues to stimulate synapses, as discussed in David’s July 2013 commentary, “Timing Method Performance Over Ten Decades” and periodically on the MFO discussion board.)

He attributes the paper’s ultimate popularity to 1) its simple presentation and explanation of the compelling results, and 2) the fortuitous timing of the publication itself – just before the financial meltdown of 2008/9. Practitioners of the method during that period were rewarded with a maximum drawdown of only -2% through versus -51% for the S&P 500.

The Books. There are three. All insightful, concise, and well-received:

MF_2

As summarized above, each contains straight-forward strategies that investors can follow on their own using publically available information. That said, each also forms the basis of ETFs launched by Cambria Investment Management.

The First Fund. Last December, Mebane tweeted “Diversification was deworseification in 2013.” To understand what he meant, just compare US stock return against just about all other asset classes – it trounced them. Several all-asset strategies have underperformed during the current bull market, as seen in the comparison below, including AdvisorShares Cambria Global Tactical ETF Fund (GTAA). GTAA was Cambria’s first ETF, launched in November 2010, as a sub-advisor through ETF house AdvisorShares, and based on the strategy outlined in “The Ivy Portfolio.”

MF_3b

If it helps, Mebane is in good company. Rob Arnott’s all asset and John Hussman’s total return strategies have not received much love lately either. In fact, since GTAA’s inception, the “generic” all-asset allocation of US stocks, foreign stocks, bonds, REITs, and broad commodities has underperformed US equity index by 40% and traditional 60/40 balanced index by 15%.

GTAA’s actual portfolio currently shows more than 50 holdings, virtually all ETFs. Looking back, the fund has held substantial cash at times, approaching 40% in mid-2013…”assuming a defensive posture and utilizing cash as an alternative to its long positions.”

Market volatility has likely hurt GTAA as well. Its timing strategy, shown to thrive in trending markets, can struggle with short-term gyrations, which have been present in commodity, foreign equity, and real estate markets during this time. Finally, AdvisorShares’ high expense ratio, even after waivers, only adds to the headwind.  At the 3.5-year mark, GTAA remains at $36M assets under management (AUM).

The New Funds. Cambria has since launched three other ETFs, based on the strategies outlined in Mebane’s two new books, but this time the funds were kept in-house to have “control over the process and charge reasonable fees.” Each fund invests in some 100 companies with capitalizations over $200M. And, each has quickly attracted AUM, rather remarkably given the proliferation of ETFs today. They are:

GVAL is the newest and actually tracks to a Cambria-developed index, maintained daily. It focuses on companies that trade 1) below their assessed intrinsic value, and 2) in countries with the most undervalued markets determined by parameters like CAPE, as depicted in earlier figure. These days, Mebane believes that means outside the US. “We certainly don’t think the [US] market is in a bubble, rather, valuations will be a headwind. There are much better opportunities abroad.

SYLD is actively managed and focuses primarily on US companies that exhibit strong characteristics of returning free cash flow to their shareholders; specifically, “shareholder yield,” which comprises dividend payments, share buybacks, and debt pay-down. FYLD seeks the same types of companies, but in developed foreign countries and it passively tracks to Cambria’s FYLD index.

Mebane believes that these are the first ETFs to incorporate the shareholder yield strategy. And, based on their reception in the crowded ETF market, he seems pretty pleased: “I certainly think alpha is possible…lots of jargon across smart beta, alpha, etc., but beating a market cap index is a great first step.” Morningstar’s Samuel Lee noted them among best new ETFs of 2013. Approaching its first year, SYLD is certainly off to a strong start:

MF_4

Interestingly, none of these three ETFs employ explicit draw-down control or trend-following, like GTAA, although GVAL does “start moving to cash if markets don’t pass an absolute valuation filter … no sense in buying what is cheapest when everything is expensive,” Mebane explains. SYLD too has the discretion to take the entire portfolio to “Temporary Defensive Positions.”

When asked if his approach to risk management is changing, given the incorporation of more traditional strategies, he asserts that he’s “still a firm believer in trend-following and future funds will have trend components.” (Other funds in pipeline at Cambria include Global Momentum ETF and Value and Momentum ETF).

Mebane remains one of the largest shareholders on record among the portfolio managers at AdvisorShares. His overall skin-in-the-game? “100% of my investable net worth is in our funds and strategies.”

The Blog. mebfaber.com (aka “World Beta”) started in November 2006. It is a pleasant blend of perspective, opinion, results from his and other’s research – quantitative and factual, images, and references. He shares generously on  both personal and professional levels, like in the recent posts “My Investing Mentor” and “How to Start an ETF.”

There is a great reading list and blogroll. There are sources for data, references, and research papers. It’s free, with occasional plugs, but no annoying pop-ups. For the more serious investors, fund managers, and institutions, he offers a premium subscription to “The Idea Farm.”

He once wrote actively for SeekingAlpha, but stopped in 2010, explaining: “I find the quality control of the site is poor, and the respect for authors to be low.  Also, [it] becomes a compliance risk and headache.”

He strikes me as having the enviable ability to absorb enormous about of information, from past lessons to today’s water-hose of publications, blogs, tweets, and op-eds, then distill it all down to chart a way forward. Asked whether this comes naturally or does he use a process, he laughs: “I would say it comes unnaturally and painfully!”

29Apr14/Charles

Ten Market Cycles

By Charles Boccadoro

Originally published in April 1, 2014 Commentary

In response to the article In Search of Persistence, published in David’s January commentary, NumbersGirl posted the following on the MFO board:

I am not enamored of using rolling 3-year returns to assess persistence.

A 3-year time period will often be all up or all down. If a fund manager has an investing personality or philosophy then I would expect strong relative performance in a rising market to be negatively correlated with poor relative performance in a falling market, etc.

It seems to me that the best way to measure persistence is over 1 (or better yet more) market cycles.

There followed good discussion about pros and cons of such an assessment, including lack of consistent definition of what constitutes a market cycle.

Echoing her suggestion, fund managers also often ask to be judged “over full cycle” when comparing performance against their peers.

A quick search of literature (eg., Standard & Poor’s Surviving a Bear Market and Doug Short’s Bear Markets in the S&P since 1950) shows that bear markets are generally “defined as a drop of 20% or more from the market’s previous high.” Here’s how the folks at Steele Mutual Fund Expert define a cycle:

Full-Cycle Return: A full cycle return includes a consecutive bull and bear market return cycle.

Up-Market Return (Bull Market): A Bull market in stocks is defined as a 20% rise in the S&P 500 Index from its previous trough, ending when the index reaches its peak and subsequently declines by 20%.

Down-Market Return (Bear Market): A Bear market in stocks is defined as a 20% decline in the S&P 500 Index from its previous peak, and ends when the index reaches its trough and subsequently rises by 20%.

Applying this definition to the SP500 intraday price index indicates there have indeed been ten such cycles, including the current one still in process, since 1956: 

tencycles_1

The returns shown are based on price only, so exclude dividends. Note that the average duration seems to match-up pretty well with so-called “short term debt cycle” (aka business cycle) described by Bridgewater’s Ray Dalio in the charming How the Economic Machine Works – In 30 Minutes video.

Here’s break-out of bear and bull markets:

tencycles_2 
The graph below depicts the ten cycles. To provide some historic context, various events are time-lined – some good, but more bad. Return is on left axis, measured from start of cycle, so each builds where previous left off. Short-term interest rate is on right axis.  

tencycles_3a

Note that each cycle resulted in a new all-time market high, which seems rather extraordinary. There were spectacular gains for the 1980 and 1990 bull markets, the latter being 427% trough-to-peak! (And folks worry lately that they may have missed-out on the current bull with its 177% gain.) Seeing the resiliency of the US market, it’s no wonder people like Warren Buffett advocate a buy-and-hold approach to investing, despite the painful -50% or more drawdowns, which have occurred three times over the period shown.

Having now defined the market cycles, which for this assessment applies principally to US stocks, we can revisit the question of mutual fund persistence (or lack of) across them.

Based on the same methodology used to determine MFO rankings, the chart below depicts results across nine cycles since 1962:

tencycles_4

Blue indicates top quintile performance, while red indicates bottom quintile. The rankings are based on risk adjusted return, specifically Martin ratio, over each full cycle. Funds are compared against all other funds in the peer group. The number of funds was rather small back in 1962, but in the later cycles, these same funds are competing against literally hundreds of peers.

(Couple qualifiers: The mural does not account for survivorship-bias or style drift. Cycle performance is determined using monthly total returns, including any loads, between the peak-to-peak dates listed above, with one exception…our database starts Jan 62 and not Dec 61.)

Not unexpectedly, the result is similar to previous studies (eg., S&P Persistence Scorecard) showing persistence is elusive at best in the mutual fund business. None of the 45 original funds in four categories delivered top-peer performance across all cycles – none even came close.

Looking at the cycles from 1973, a time when several now well know funds became established, reveals a similar lack of persistence – although one or two come close to breaking the norm. Here is a look at some of the top performing names:

tencycles_5

MFO Great Owls Mairs & Powers Balanced (MAPOX) and Vanguard Wellington (VWELX) have enjoyed superior returns the last three cycles, but not so much in the first. The reverse is true for legendary Fidelity Magellan (FMAGX).

Even a fund that comes about as close to perfection as possible, Sequoia (SEQUX), swooned in the late ‘90s relative to other growth funds, like Fidelity Contrafund (FCNTX), resulting in underperformance for the cycle. The table below details the risk and return metrics across each cycle for SEQUX, showing the -30% drawdown in early 2000, which marked the beginning of the tech bubble. In the next couple years, many other growth funds would do much worse.

tencycles_6

So, while each cycle may rhyme, they are different, and even the best managed funds will inevitably spend some time in the barrel, if not fall from favor forever.

We will look to incorporate full-cycle performance data in the single-ticker MFO Risk Profile search tool. As suggested by NumbersGirl, it’s an important piece of due diligence and risk cognizance for all mutual fund investors.

26Mar14/Charles

Morningstar’s Risk Adjusted Return Measure

By Charles Boccadoro

Originally published in March 1, 2014 Commentary

Central to any fund rating system is the performance measure used to determine percentile rank order. MFO uses Martin ratio, as described Rating System Definitions. Morningstar developed its own risk adjusted return (MRAR), which Nobel Laureate William Sharpe once described as a measure that “…differs significantly from more traditional ones such as various forms of the Sharpe ratio.” While the professor referred to an earlier version of MRAR, the same holds true today.

Here is how Morningstar describes MRAR on its Data FAQ page: Morningstar adjusts for risk by calculating a risk penalty for each fund based on “expected utility theory,” a commonly used method of economic analysis. Although the math is complex, the basic concept is relatively straightforward. It assumes that investors are more concerned about a possible poor outcome than an unexpectedly good outcome and that those investors are willing to give up a small portion of an investment’s expected return in exchange for greater certainty. A “risk penalty” is subtracted from each fund’s total return, based on the variation in its month-to-month return during the rating period, with an emphasis on downward variation. The greater the variation, the larger the penalty. If two funds have the exact same return, the one with more variation in its return is given the larger risk penalty.

For the curious and mathematically inclined, the detailed equations are well documented in The Morningstar Rating Methodology. The following figure illustrates how MRAR behaves for three hypothetical funds over a 3 year period ending Dec 2013:

hypothetical fundsfund012

Each fund in the illustration delivers the same total return, but with varying levels of volatility. The higher the volatility, the lower the risk adjusted return. Fund 0 delivers consistent returns every month with zero volatility; consequently, it receives the highest MRAR, which in this case is the fund’s annualized total return minus the risk-free T-Bill (i.e., it’s the annualized “excess” return).

Morningstar computes MRAR for all funds over equivalent periods, and then percentile ranks them within their respective categories to assign appropriate levels, 1 star for those funds in the lowest group and the coveted 5 star rating for the highest.

It also computes a risk measure MRisk and performs a similar ranking to designate “low” to “high” risk funds within each category. MRisk is simply the difference between the annualized excess return of the fund and its MRAR.

The following figure provides further insight into how MRAR behaves for funds of varying volatility. This time, fund total returns have been scaled to match their category averages, again for the 3 year period ending Dec 2013. The figure includes results from several categories showing MRAR versus the tradition volatility measure, annualized standard deviation.

mrar sensitivity

Once again we see that funds with higher volatility generally receive lower MRARs and that the highest possible MRAR is equal to a fund’s annualized excess return, which occurs at zero standard deviation.

A consequence of Morningstar’s methodology is that low volatility funds with below average returns can quite possibly be out-ranked by average volatility funds with average returns. Put another way, the methodology generally penalizes funds with high volatility more so than it rewards funds with low volatility, since with the latter the benefit is “capped.”

This behavior is different from other risk adjusted return measures based on say Sharpe ratio, as can be seen in the figure below. Here the same funds from above are plotted against Sharpe, but now funds with low volatility are rewarded handsomely, even if they have below average total returns.

sharpe sensitivity

Revisiting the Morningstar risk measure MRisk, one finds another observation: it appears to correlate rather satisfactorily against a simple function based on standard deviation (up to about 30% for funds of positive total return without load):
morningstar risk

Which means that Morningstar’s risk adjusted return can be estimated from the following:

morningstar mrar

This simple approximation may come in handy, like when David wonders: “Why do RPHIX and ICMYX, which have superior 3 year Sharpe ratios, rate a very inferior 1 star by Morningstar?” He can use the above calculation to better understand, as illustrated here:

mrar approximation

While both do indeed have great 3 year Sharpe ratios – RPHIX is highest of any US fund – they both have below average total returns relative to their current peer group, as represented by say VWEHX, a moderate risk and average returning high yield bond “reference” fund.

Their low volatilities simply get no love from Morningstar’s risk adjusted return measure.

27Feb2014/Charles

Impact of Category on Fund Ratings

By Charles Boccadoro

Originally published in February 1, 2014 Commentary

The results for MFO’s fund ratings through quarter ending December 2013, which include the latest Great Owl and Three Alarm funds, can be found on the Search Tools page. The ratings are across 92 fund categories, defined by Morningstar, and include three newly created categories:

Corporate Bond. “The corporate bond category was created to cull funds from the intermediate-term and long-term bond categories that focused on corporate bonds,” reports Cara Esser.  Examples are Vanguard Interm-Term Invmt-Grade Inv (VFICX) and T. Rowe Price Corporate Income (PRPIX).

Preferred Stock. “The preferred stock category includes funds with a majority of assets invested in preferred stock over a three-year period. Previously, most preferred share funds were lumped in with long-term bond funds because of their historically high sensitivity to long-term yields.” An example is iShares US Preferred Stock (PFF).

Tactical Allocation. “Tactical Allocation portfolios seek to provide capital appreciation and income by actively shifting allocations between asset classes. These portfolios have material shifts across equity regions and bond sectors on a frequent basis.” Examples here are PIMCO All Asset All Authority Inst (PAUIX) and AQR Risk Parity (AQRIX).

An “all cap” or “all style” category is still not included in the category definitions, as explained by John Rekenthaler in Why Morningstar Lacks an All-Cap Fund Category. The omission frustrates many, including BobC, a seasoned contributor to the MFO board:

Osterweis (OSTFX) is a mid-cap blend fund, according to M*. But don’t say that to John Osterweis. Even looking at the style map, you can see the fund covers all of the style boxes, and it has about 20% in foreign stocks, with 8% in emerging countries. John would tell you that he has never managed the fund to a style box. In truth he is style box agnostic. He is looking for great companies to buy at a discount. Yet M* compares the fund with others that are VERY different.

In fairness, according to the methodology, “for multiple-share-class funds, each share class is rated separately and counted as a fraction of a fund within this scale, which may cause slight variations in the distribution percentages.” Truth is, fund managers or certainly their marketing departments are sensitive to what category their fund lands-in, as it can impact relative ratings for return, risk, and price.

As reported in David’s October commentary, we learned that Whitebox Funds appealed to the Morningstar editorial board to have its Tactical Opportunities Fund (WBMIX) changed from aggressive allocation to long/short equity. WBMIX certainly has the latitude to practice long/short; in fact, the strategy is helping the fund better negotiate the market’s rough start in 2014. But its ratings are higher and price is lower, relatively, in the new category.

One hotly debated fund on the MFO board, ASTON/River Road Independent Small Value (ARIVX), managed by Eric Cinnamond, would also benefit from a category change. As a small cap, the fund rates a 1 (bottom quintile) for 2013 in the MFO ratings system, but when viewed as a conservative or tactical allocation fund – because of significant shifts to cash – the ratings improve. Here is impact on return group rank for a couple alternative categories:

2014-01-26_1755

Of course, a conservative tactical allocation category would be a perfect antidote here (just kidding).

Getting It Wrong. David has commented more than once about the “wildly inappropriate” mis-categorization of Riverpark Short Term High Yield Fund (RPHIX), managed by David Sherman, which debuted with just a single star after its first three years of operation. The MFO community considers the closed fund more of a cash alternative, suited best to the short- or even ultrashort-term bond categories, but Morningstar placed it in the high yield bond category.

Exacerbating the issue is that the star system appears to rank returns after deducting for a so-called “risk penalty,” based on the variation in month-to-month return during the rating period. This is good. But it also means that funds like RPHIX, which have lower absolute returns with little or no downside, do not get credit for their very high risk-adjusted return ratios, like Sharpe, Sortino, or Martin.

Below is the impact of categorization, as well as return metrics, on its performance ranking. The sweet irony is that its absolute return even beat the US bond aggregate index!

2014-01-28_2101

RPHIX is a top tier fund by just about any measure when placed in a more appropriate bond category or when examined with risk-adjusted return ratios. (Even Modigliani’s M2, a genuinely risk-adjusted return, not a ratio, that is often used to compare portfolios with different levels of risk, reinforces that RPHIX should still be top tier even in the high yield bond category.) Since Morningstar states its categorizations are “based strictly on portfolio statistics,” and not fund names, hopefully the editorial board will have opportunity to make things right for this fund at the bi-annual review in May.

A Broader View. Interestingly, prior to July 2002, Morningstar rated funds using just four broad asset-class-based groups: US stock, international stock, taxable bond, and municipal bonds. It switched to (smaller) categories to neutralize market tends or “tailwinds,” which would cause, for example, persistent outperformance by funds with value strategies.

A consequence of rating funds within smaller categories, however, is more attention goes to more funds, including higher risk funds, even if they have underperformed the broader market on a risk-adjusted basis. And in other cases, the system calls less attention to funds that have outperformed the broader market, but lost an occasional joust in their peer group, resulting in a lower rating.

Running the MFO ratings using only the four board legacy categories reveals just how much categorization can alter the ratings. For example, the resulting “US stock” 20-year Great Owl funds are dominated by allocation funds, along with a high number of sector equity funds, particularly health. But rate the same funds with the current categories (Great Owl Funds – 4Q2013), and we find more funds across the 3 x 3 style box, plus some higher risk sector funds, but the absence of health funds.

Fortunately, some funds are such strong performers that they appear to transcend categorization. The eighteen funds listed below have consistently delivered high excess return while avoiding large drawdown and end-up in the top return quintile over the past 20, 10, 5, and 3 year evaluation periods using either categorization approach:

2014-01-28_0624 
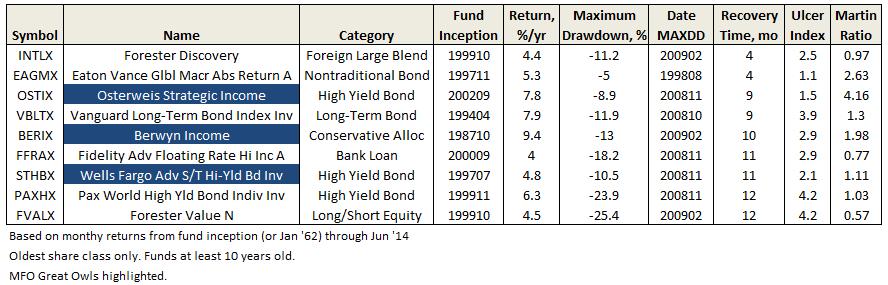
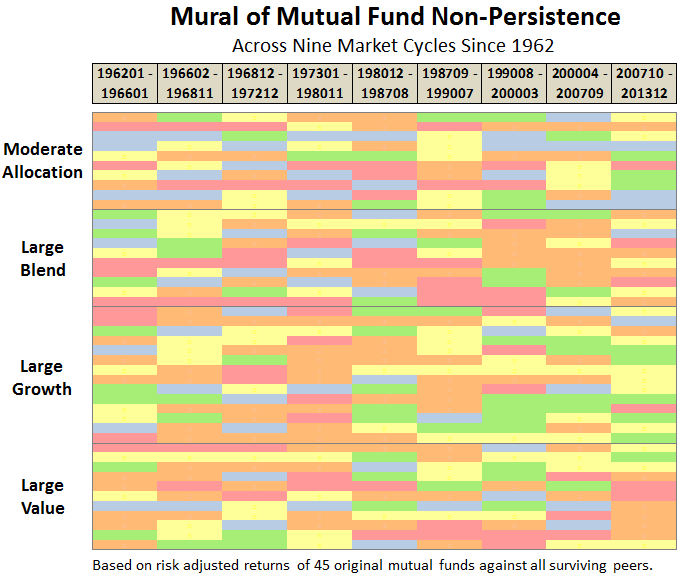
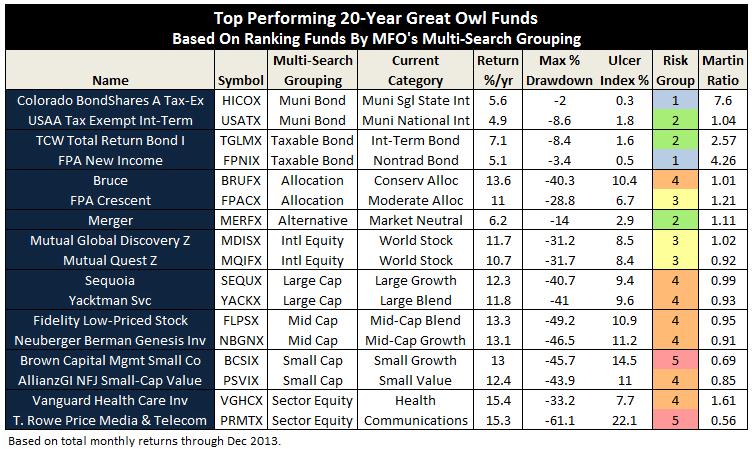
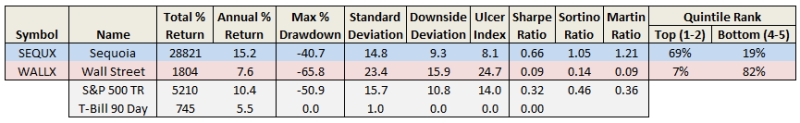
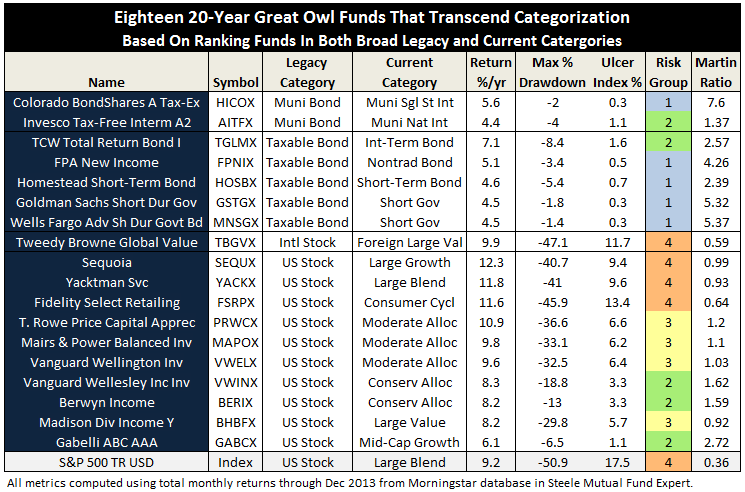
Roy Weitz grouped funds into only five equity and six specialty “benchmark categories” when he established the legacy Three Alarm Funds list. Similarly, when Accipiter created the MFO Miraculous Multi-Search tool, he organized the 92 categories used in the MFO rating system into 11 groups…not too many, not too few. Running the ratings for these groupings provides some satisfying results:

2014-01-28_1446_001

A more radical approach may be to replace traditional style categories altogether! For example, instead of looking for best performing small-cap value funds, one would look for the best performing funds based on a risk level consistent with an investor’s temperament. Implementing this approach, using Risk Group (as defined in ratings system) for category, identifies the following 20-year Great Owls:

2014-01-28_1446

Bottom Line. Category placement can be as important to a fund’s commercial success as its people, process, performance, price and parent. Many more categories exist today on which peer groups are established and ratings performed, causing us to pay more attention to more funds. And perhaps that is the point. Like all chambers of commerce, Morningstar is as much a promoter of the fund industry, as it is a provider of helpful information to investors. No one envies the enormous task of defining, maintaining, and defending the rationale for several dozen and ever-evolving fund categories. Investors should be wary, however, that the proliferation may provide a better view of the grove than the forest.

28Jan2014/Charles

In Search of Persistence

By Chip

Originally published in January 1, 2014 Commentary

It’s 1993. Ten moderate allocation funds are available that have existed for 20 years or more. A diligent, well intended investor wants to purchase one of them based on persistent superior performance. The investor examines rolling 3-year risk-adjusted returns every month during the preceding 20 years, which amounts to 205 evaluation periods, and delightfully discovers Virtus Tactical Allocation (NAINX).

It outperformed nearly 3/4ths of the time, while it under-performed only 5%. NAINX essentially equaled or beat its peers 194 out of 205 periods. Encouraged, the investor purchases the fund making a long-term commitment to buy-and-hold.

It’s now 2013, twenty years later. How has NAINX performed? To the investor’s horror, Virtus Tactical Allocation underperformed 3/4ths of the time since purchased! And the fund that outperformed most persistently? Mairs & Power Balanced (MAPOX), of course.

Back to 1993. This time a more aggressive investor applies the same methodology to the large growth category and finds an extraordinary fund, named Fidelity Magellan (FMAGX).  This fund outperformed nearly 100% of the time across 205 rolling 3-year periods over 20 years versus 31 other long-time peers. But during the next 20 years…? Not well, unfortunately. This investor would have done better choosing Fidelity Contrafund (FCNTX). How can this be? Most industry experts would attribute the colossal shift in FMAGX performance to the resignation of legendary fund manager Peter Lynch in 1990.

virtus fidelity

MJG, one of the heavy contributors to MFO’s discussion board, posts regularly about the difficulty of staying on top of one’s peer group, often citing results from Standard & Poor’s Index Versus Active Indexing (SPIVA) reports. Here is the top lesson-learned from ten years of these reports:

“Over a five-year horizon…a majority of active funds in most categories fail to outperform indexes. If an investing horizon is five years or longer, a passive approach may be preferable.”

The December 2013 SPIVA “Persistence Scorecard” has just been published, which Joshua Brown writes insightfully about in “Persistence is a Killer.” The scorecard once again shows that only a small fraction of top performing domestic equity mutual funds remain on top across any 2, 3, or 5 year period.

What does mutual fund non-persistence look like across 40 years? Here’s one depiction:

mutual fund mural

The image (or “mural”) represents monthly rank by color-coded quintiles of risk-adjusted returns, specifically Martin Ratio, for 101 funds across five categories. The funds have existed for 40 years through September 2013. The calculations use total monthly returns of oldest share class only, ignoring any load, survivor bias, and category drift.  Within each category, the funds are listed alphabetically.

There are no long blue/green horizontal streaks. If anything, there seem to be more extended orange/red streaks, suggesting that if mutual fund persistence does exist, it’s in the wrong quintiles! (SPIVA actually finds similar result and such bottom funds tend to end-up merged or liquated.)

Looking across the 40 years of 3-year rolling risk-adjusted returns, some observations:

  • 98% of funds spent some periods in every rank level…top, bottom, and all in-between
  • 35% landed in the bottom two quintiles most of the time…that’s more than 1/3rd of all funds
  • 13% were in the top two bottom quintiles…apparently harder to be persistently good than bad
  • Sequoia (SEQUX) was the most persistent top performer…one of greatest mutual funds ever
  • Wall Street (WALLX) was the most persistent cellar dweller…how can it still exist?

sequoia v wall street

The difference in overall return between the most persistent winner and loser is breathtaking: SEQUX delivered 5.5 times more than SP500 and 16 times more than WALLX. Put another way, $10K invested in SEQUX in October 1973 is worth nearly $3M today. Here’s how the comparison looks:

sequx wallx sp500

So, while attaining persistence may be elusive, the motivation to achieve it is clear and present.

The implication of a lack of persistence strikes at the core of all fund rating methodologies that investors try to use to predict future returns, at least those based only on historical returns. It is, of course, why Kiplinger, Money, and Morningstar all try to incorporate additional factors, like shareholder friendliness, experience, and strategy, when compiling their Best Funds lists. An attempt, as Morningstar well states, to identify “funds with the highest potential of success.”

The MFO rating system was introduced in June 2013. The current 20-year Great Owls, shown below for moderate allocation and large growth categories, include funds that have achieved top performance rank over the past 20, 10, 5, and 3 year evaluation periods. (See Rating Definitions.)

20 year GOs

But will they be Great Owls next year? The system is strictly quantitative based on past returns, which means, alas, a gentle and all too ubiquitous reminder that past performance is not a guarantee of future results. (More qualitative assessments of fund strategy, stewardship, and promise are provided monthly in David’s fund profiles.) In any case and in the spirit of SPIVA, we will plan to publish periodically a Great Owl “Persistence Scorecard.”

31Dec2013/Charles