Category Archives: Most intriguing new funds

Janus Henderson Absolute Return Income Opportunities Fund (formerly Janus Global Unconstrained Bond), (JUCAX), October 2014

By David Snowball

At the time of publication, this fund was named Janus Global Unconstrained Bond Fund.

Objective and strategy

The fund is seeking maximum total return, consistent with preservation of capital. Consistent with its name, the manager is free to invest in virtually any income-producing security; the prospectus lists corporate and government bonds, both international and domestic, convertibles, preferred stocks, common stocks “which have the potential for paying dividends” and a wide variety of derivatives. Up to 50% of the portfolio may be invested in emerging markets. The manager can lend, presumably to short-sellers, up to one-third of the portfolio. The duration might range from negative three years, a position in which the portfolio would rise if interest rates rose, to eight years.

Adviser

Janus Capital Management, LLC. Janus is a Denver-based investment advisor that manages $178 billion in assets. $103 billion of those assets are in mutual funds. Janus was made famous by the success of its gun-slinging equity funds in the 1990s and infamous by the failure of its gun-slinging equity funds in the decade that followed. It made headlines for management turmoil, involvement in a market-timing scandal, manager departures and lawsuits. Janus advises 54 Janus, Janus Aspen, INTECH and Perkins mutual funds; of those, 28 have managers with three years or less on the job.

Manager

William Gross. Mr. Gross founded PIMCO, as well as serving as a managing director, portfolio manager and chief investment officer for them. Morningstar recognized him as its fixed income manager of the decade for 2000-09 and has named him as fixed-income manager of the year on three occasions. His media handle was “The Bond King,” a term which Google finds associated with his name on 100,000 occasions. He was generally recognized as one of the industry’s three most accomplished fixed-income investors, along with Jeffrey Gundlach of DoubleLine and Dan Fuss of Loomis Sayles. At the time of his departure from PIMCO, he was responsible for $1.8 trillion in assets and managed or co-managed 34 mutual funds.

Strategy capacity and closure

Not yet reported. PIMCO allowed its Unconstrained Bond fund, which Mr. Gross managed in 2014, to remain open after assets reached $20 billion. That fund has trailed two-thirds or more its “non-traditional bond” peers for the past one- , three- and five-year periods.

Active share

Not available.

Management’s stake in the fund

Not yet recorded. Mr. Gross reputedly had $240 million invested in various PIMCO funds and might be expected to shift a noticeable fraction of those investments here but there’s been no public statement on the matter.

Opening date

May 27, 2014.

Minimum investment

$2,500 for “A” shares and no-load “T” shares. There are, in whole, seven share classes. Brokerage availability is limited, a condition which seems likely to change.

Expense ratio

The fund has 8 different share class with expense ratios ranging from 0.63% to 1.71% and assets under management of $58.7 million, as of July 2023. 

Comments

The question isn’t whether this fund will draw billions of dollars. It will. Mr. Gross, a billionaire, has a personal investment in the PIMCO funds reportedly worth $250 million. I expect much will migrate here. He’s been worshipped by institutional investors and sovereign wealth fund managers. Thousands of financial advisors will see the immediate opportunity to “add value” by “moving ahead of the crowd.”  The Wall Street Journal reported that PIMCO saw $10 billion in asset outflows at the announcement of Mr. Gross’s departure (“Pimco’s New CIOs: ‘Bill Gross Relied on Us,’” 9/29/14) and speculated that outflows could reach $100 billion.

No, the question isn’t whether this fund attracts money. It’s whether the fund should attract your money.

Three factors would predispose me against such an investment.

  1. Mr. Gross’s reported behavior does not inspire confidence. Mr. Gross’s departure from PIMCO was not occasioned by poor performance; it was occasioned by poor behavior. The evidence available suggests that he has become increasingly autocratic, irascible, disrespectful and inconsistent. The record of PIMCO’s loss of talented staff – both those who left because they could not tolerate Mr. Gross’s behavior and those who apparently threatened to resign en masse over it – speaks to a sustained, substantial problem. Josh Brown of Ritzholz Wealth Management suspects that Gross’s dramatically wrong market bets led him “to hunker down. To throw people out of one’s office when they voice dissension. To view the movement of the market as an affront to one’s intelligence … for a highly-visible professional investor [such a mindset] becomes utterly debilitating.” We’ve wondered, especially after the Morningstar presentation, whether there might be a health issue somewhere in the background. Regardless of its source, the behavior is an unresolved problem.

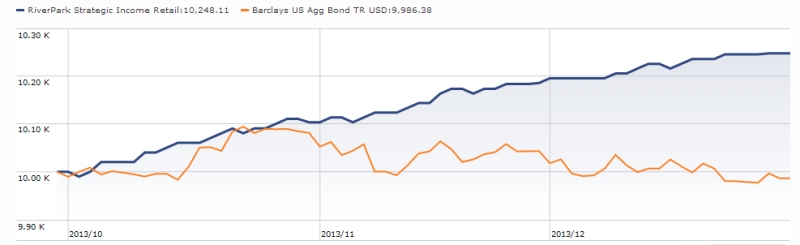
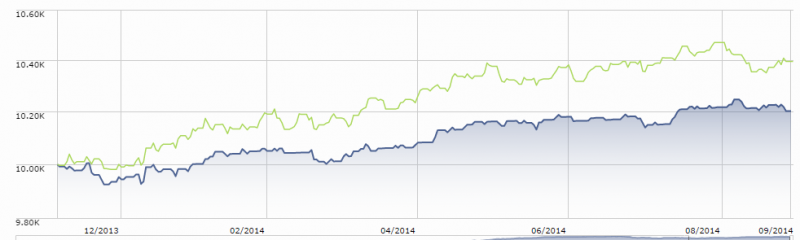
  2. Mr. Gross’s recent performance does not inspire confidence. Not to put too fine a point on it, but Mr. Gross already served as manager of an unconstrained bond portfolio, PIMCO Unconstrained Bond and its near-clone Harbor Unconstrained Bond, and his performance was distinctly mediocre. He assumed control of the fund in December 2013 when Chris Dialynis took a sudden sabbatical which some now attribute to fallout from an internal power struggle. Regardless of the motive, Mr. Gross assumed control and trailed his peers (the green line) through the year.
    janus

    While the record is too short to sustain much of a judgment, it does highlight the fact that Mr. Gross does not arrive bearing a magic wand.

  3. Mr. Gross is apt to feel that he’s got something to prove. It is hard to imagine that he does not approach this new assignment with a considerable chip on his shoulder. He has always had a penchant for bold moves, some of which have substantially damaged his shareholders. Outsized bets in favor of TIPs and emerging markets bonds (2013) and against Treasuries (2011) are typical of the “Macro bets [that] have come to dominate the fund’s high-level decision-making in recent years” (Morningstar analyst Eric Jacobson, July 16 2013). The combination of a tendency to make bold bets and the unavoidable pressure to show the world they were wrong is fundamentally troubling.

Bottom Line

Based on Mr. Gross’s long track record with PIMCO Total Return, you might be hoping for returns that exceed their benchmark by 1-2% per year. Over the course of decades, those gains would compound mightily but Mr. Gross, 70, will not be managing this fund for decades. The question is, what risk are you assuming in pursuit of those very modest gains over the relatively modest period in which he’s likely to run the fund? Shorn of his vast analyst corps and his place on the world stage, the answer is not clear. As a general rule, in the most conservative part of your portfolio, clarity on such matters would be deeply desirable. We’d counsel watchful waiting, the fund is likely to still be available in six months and the picture will be far clearer then.

Fund website

Janus Henderson Absolute Return Income Opportunities Fund

[cr2014]

KL Allocation Fund (formerly GaveKal Knowledge Leaders), (GAVAX/GAVIX), August 2014

By David Snowball

At the time of publication, this fund was named GaveKal Knowledge Leaders Fund.

Objective and strategy

The fund is trying to grow capital, with the particular goal of beating the MSCI World Index over the long term. They invest in between 40 and 60 stocks of firms that they designate as “knowledge leaders.” By their definition, “Knowledge Leaders” are a group of the world’s leading innovators with deep reservoirs of intangible capital. These companies often possess competitive advantages such as strong brand, proprietary knowledge or a unique distribution mechanism. Knowledge leaders are largely service-based and advanced manufacturing businesses, often operating globally.” Their investable universe is mid- and large-cap stocks in 24 developed markets. They buy those stocks directly, in local currencies, and do not hedge their currency exposure. Individual holdings might occupy between 1-5% of the portfolio.

Adviser

GaveKal Capital (GC). GC is the US money management affiliate of GaveKal Research Ltd., a Hong Kong-based independent research boutique. They manage over $600 million in the Knowledge Leaders fund and a series of separately managed accounts in the US as well as a European version (a UCITS) of the Knowledge Leaders strategy.

Manager

Steven Vannelli. Mr. Vannelli is managing director of GaveKal Capital, manager of the fund and lead author of the firm’s strategy for how to account for intangible capital. Before joining GaveKal, he served for 10 years at Denver-based money management firm Alexander Capital, most recently as Head of Equities. He manages about $600 million in assets and is assisted by three research analysts, each of whom targets a different region (North America, Europe, Asia).

Strategy capacity and closure

With a large cap, global focus, they believe they might easily manage something like $10 billion across the three manifestations of the strategy.

Active share

91. “Active share” measures the degree to which a fund’s portfolio differs from the holdings of its benchmark portfolio.  High active share indicates management which is providing a portfolio that is substantially different from, and independent of, the index. An active share of zero indicates perfect overlap with the index, 100 indicates perfect independence. The active share for the Knowledge Leaders Fund is 91, which reflects a very high level of independence from its benchmark MSCI World Index.

Management’s stake in the fund

Minimal. Mr. Vannelli seeded the fund with $250,000 of his own money but appears to have disinvested over time. His current stake is in the $10,000-50,000 range. As one of the eight partners as GaveKal, he does have a substantial economic stake in the advisor. There is no corporate policy encouraging or requiring employee investment in the fund and none of the fund’s directors have invested in it.

Opening date

September 30, 2010 for the U.S. version of the fund. The European iteration of the fund launched in 2006.

Minimum investment

$2500

Expense ratio

1.5% on A-share class (1.25% on I-share class) on domestic assets of $190 million, as of July 2014.

Comments

The stock investors have three nemeses:

  • Low long-term returns
  • High short-term volatility
  • A tendency to overpay for equities

Many managers specialize in addressing one or two of these three faults. GaveKal thinks they’ve got a formula for addressing three of three.

Low long-term returns: GaveKal believes that large stocks of “intangible capital” are key drivers of long-term returns and has developed a database of historic intangible-adjusted financial data, which it believes gives it a unique perspective. Intangible capital represents investments in a firm’s future profitability. It includes research and development investments but also expenditures to upgrade the abilities of their employees. There’s unequivocal evidence that such investments drive a firm’s long-term success. Sadly, current accounting practices punish firms that make these investments by characterizing them as “expenses,” the presence of which make the firm look less attractive to short-term investors. Mr. Vannelli’s specialty has been in tracking down and accurately characterizing such investments in order to assess a firm’s longer-term prospects. By way of illustration, research and development investments as a percentage of net sales are 8.3% in the portfolio companies but only 2.4% in the index firms.

High short-term volatility: there’s unequivocal empirical and academic research that shows that investors are far more cowardly than they know. While we might pretend to be gunslingers, we’re actually likely to duck under the table at the first sign of trouble. Knowing that, the manager works to minimize both security and market risk for his investors. They limit the size of any individual position to 5% of the portfolio. They entirely screen out a number of high leverage sectors, especially those where a firm’s fate might be controlled by government policies or other macro factors. The excluded sectors include financials, commodities, utilities, and energy. Conversely, many of the sectors with high concentrations of knowledge leaders are defensive.  Health care, for example, accounts for 86 of the 565 stocks in their universe.

Finally, they have the option to reduce market exposure when some combination of four correlation and volatility triggers are pulled. They monitor the correlation between stocks and bonds, the correlation between stocks within a broad equity index, the correlation between their benchmark index and the VIX and the absolute level of the VIX. In high risk markets, they’re at least 25% in cash (as they are now) and might go to 40% cash. When the market turns, though, they will move decisively back in: they went from 40% cash to 3% in under two weeks in late 2011.

A tendency to overpay: “expensive” is always relative to the quality of goods that you’re buying. GaveKal assigns two grades to every stock, a valuation grade based on factors such as price to free cash flow relative both to a firm’s own history and to its industry’s and a quality grade based on an analysis of the firm’s balance sheet, cash flow and income statement. Importantly, Gavekal uses its proprietary intangible-adjusted metrics in the analysis of value and quality.

The analysts construct three 30 stock regional portfolios (e.g., a 30 stock European portfolio) from which Mr. Vannelli selects the 50-60 most attractively valued stocks worldwide.

In the end, you get a very solid, mildly-mannered portfolio. Here are the standard measures of the fund against its benchmark:


GAVAX

MSCI World

Beta

.42

1.0

Standard deviation

7.1

13.8

Alpha

6.3

0

Maximum drawdown

(3.3)

(16.6)

Upside capture

.61

1.0

Downside capture

.30

1.0

Annualized return, since inception

10.5

13.4

While the US fund was not in operation in 2008, the European version was. The European fund lost about 36% in 2008 while its benchmark fell 46%.  Since the US fund is permitted a higher cash stake than its European counterpart, it follows that the fund’s 2008 outperformance might have been several points higher.

Bottom Line

This is probably not a fund for investors seeking unwaveringly high exposure to the global equities market. Its cautious, nearly absolute-return, approach to has led many advisors to slot it in as part of their “nontraditional/liquid alts” allocation. The appeal to cautious investors and the firm’s prodigious volume of shareholder communications, including weekly research notes, has led to high levels of shareholder loyalty and a prevalence of “sticky money.” While I’m perplexed by the fact that so little of the sticky money is the manager’s own, the fund has quietly made a strong case for its place in a conservative equity portfolio.

Fund website

GaveKal Knowledge Leaders. While you’re there, read the firm’s white paper on Intangible Economics and their strategy presentation (2014) which explains the academic research, the accounting foibles and the manager’s strategy in clear language.

[cr2014]

Artisan High Income (ARTFX), July 2014

By David Snowball

Objective and Strategy

Artisan High Income seeks to provide total return through a combination of current income and capital appreciation. They invest in a global portfolio of high yield corporate bonds and secured and unsecured loans. They pursue issuers with high quality business models that have compelling risk-adjusted return characteristics.

They highlight four “primary pillars” of their discipline:

Business Quality, including both the firm’s business model and the health of the industry. 

Financial Strength and Flexibility, an inquiry strongly conditioned by the firm’s “history and trend of free cash flow generation.”

Downside Analysis. Their discussion here is worth quoting in full: “The team believes that credit instruments by their nature have an asymmetric risk profile. The risk of loss is often greater than the potential for gain, particularly when looking at below investment grade issuers. The team seeks to manage this risk with what it believes to be conservative financial projections that account for industry position, competitive dynamics and positioning within the capital structure.”

Value Identification, including issues of credit improvement, relative value, catalysts for business improvement and “potential value stemming from market or industry dislocations.”

The portfolio is organized around high conviction core positions (20-60% of assets), “spread” positions where the team fundamentally disagrees with the consensus view (10-50%) and opportunistic positions which might be short-term opportunities triggered by public events that other investors have not been able to digest and respond to (10-30%).

Adviser

Artisan Partners, L.P. Artisan is a remarkable operation. They advise the 14 Artisan funds (all of which have a retail (Investor) share class since its previously institutional emerging markets fund advisor share class was redesignated in February.), as well as a number of separate accounts. The firm has managed to amass over $105 billion in assets under management, of which approximately $61 billion are in their mutual funds. Despite that, they have a very good track record for closing their funds and, less visibly, their separate account strategies while they’re still nimble. Seven of the firm’s 14 funds are closed to new investors, as of July 2014.  Their management teams are stable, autonomous and invest heavily in their own funds.

Manager

Bryan C. Krug.  Mr. Krug joined Artisan in December 2013.  From 2001 until joining Artisan, Mr. Krug worked for Waddell & Reed and, from 2006, managed their Ivy High Income Fund (WHIAX).  Mr. Krug leads Artisan’s Kansas City-based Credit Team. His work is supported by three analysts (Joanna Booth, Josh Basler and Scott Duba).  Mr. Krug interviewed between 40 and 50 candidates in his first months at Artisan and seems somewhere between upbeat and giddy (well, to the extent fixed-income guys ever get giddy) at the personal and professional strengths of the folks he’s hired.

Strategy capacity and closure

There’s no preset capacity estimate. Mr. Krug makes two points concerning the issue. First, he’s successfully managed $10 billion in this strategy at his previous fund. Second, he’s dedicated to being an investment organization first and foremost; if at any point market changes or investor inflows threaten his ability to benefit his investors, he’ll close the fund. Artisan Partners has a long record of supporting their managers’ decision to do just that.

Management’s Stake in the Fund

Not yet disclosed. In general, Artisans staff and directors have invested between hundreds of thousands to millions of their own dollars in the Artisan complex.

Opening date

March 19, 2014

Minimum investment

$1,000

Expense ratio

0.95% on assets of $6.5 Billion, as of June 2023. There’s also a 2.0% redemption fee on shares held under 90 days.

Comments

There is a real question about whether mid 2014 is a good time to begin investing in high yield bonds. Skeptics point to four factors:

  • Yields on junk bonds are at or near record lows (see “Junk bond yields at new and terrifying lows,” 06/24/2014)
  • The spread from junk and investment grade bonds, that is, the addition income you receive for investing in a troubled issuer, is at or near record lows (“New record low,” 06/17/2014).
  • Demand for junk is at or near record highs.
  • Issuance of new junk – sometimes stuff being rushed to market to help fatten the hogs – is at or near record highs. Worried about high demand and low standards, Fed chair Janet Yellen allowed that “High-yield bonds have certainly caught our attention.” The junk market immediately rallied on the warning, with yields falling even lower (“Yellen’s risky debt warning leads to rally in risky debt,” 06/20/2014).

All of that led the estimable John Waggoner to announce that it’s “Time to sell your junk” (06/26/2014.).

None of that comes as news to Bryan Krug. His fund attracted nearly $300 million in three months and, as of late June, he reported that the portfolio was fully invested. He makes two arguments in favor of Artisan’s new fund:

First. Pricing in high yield debt is remarkably inefficient, so that even in richly valuable markets there are exploitable pockets of mispricing. “[W]e believe there is no shortage of inefficiencies … the market is innately complex and securities are frequently mispriced, which benefits those investors who are willing to roll up their sleeves and perform detailed, bottom-up analysis.” The market’s overall valuation is important primarily if you’re invested in a passive vehicle.

Second. High yield and loans do surprisingly well in many apparently hostile environments. In the past quarter century, there have been 16 sharp moves up in interest rates (more than 70 bps in a quarter); high yield bonds have returned, on average, 2.5% during those quarters and leveraged loans returned 3.9%. Even if we exclude the colossal run-up in the second quarter of 2009 (the turn off the March market bottom, where both groups gained over 20% in three months) returns for both groups are positive, though smaller.

Returns for investment grades bonds were, on average, notably negative. Being careful about the quality of the underlying business makes a huge difference. In 2008 Mr. Krug posted top tier results not because his bonds held up but because they didn’t go to zero. “We avoided permanent loss of capital by investing in better businesses, often asset-light firms with substantial, undervalued intellectual property.” There were, he says, no high fives that year but considerable relief that they contained the worst of the damage.

The fund has the flexibility of investing elsewhere in a firm’s capital structure, particularly in secured and unsecured loans. As of late June, those loans occupied about a third of the portfolio. That’s nearly twice the amount that he has, over the long term, committed to such defensive positions. His experience, concern for quality, and ability to shift has allowed his funds to weave their way through several tricky markets: over the past five years, his fund outperformed in all three quarters when the high yield group lost money and all four in which the broad bond market did. Indeed, he posted gains in three of the four quarters in which the bond market fell.

If you decide that you want to increase your exposure to such investments, there are few safer bets than Artisan. Artisan’s managers are organized into six autonomous teams, each with responsibility for its own portfolios and personnel. The teams are united by four characteristics:

  • pervasive alignment of interests with their shareholders – managers, analysts and directors are all deeply invested in their funds, the managers have and have frequently exercised the right to close funds and other manifestations of their strategies, the partners own the firm and the teams are exceedingly stable.
  • price sensitivity – Mr. Krug reports Artisan’s “firm believe that margins of safety should not be compromised,” which reflects the firm-wide ethos as well.
  • a careful, articulate strategy for portfolio weightings – the funds generally have clear criteria for the size of initial positions in the portfolio, the upsizing of those positions with time and their eventual elimination, and
  • uniformly high levels of talent – Artisan interviews a lot of potential managers each year, but only hires managers who they believe will be “category killers.” 

Those factors have created a tradition of consistent excellence across the Artisan family. By way of illustration:

  • Eleven of Artisan’s 14 retail funds are old enough to have Morningstar ratings. Eight of those funds have earned four or five stars. 
  • Ten of the 11 have been recognized as “Silver” or “Gold” funds by Morningstar’s analysts. 
  • Artisan teams have been nominated for Morningstar’s “manager of the year” award nine times in the past 15 years; they’ve won four times.

And none are weak funds, though some do get out of step with the market from time to time. That, by the way, is a good thing.

Bottom Line

In general, it’s unwise to make long-term decisions based on short-term factors. While valuation concerns are worrisome and might reasonably influence your decisions about new money in your portfolio, it makes no sense to declare high yield off limits because of valuation concerns any more than it would be to declare that equities or investment grade bonds (both of which might be less attractively valued than high income securities) have no place in your portfolio. Caution is sensible. Relying on an experienced manager is sensible. Artisan High Income is sensible. I’d consider it.

Fund website

Artisan High Income. There’s a nice six page research report, Recognizing Opportunities in Non-Investment Grade Credit, available there.

By way of disclosure: while the Observer has no financial relationship with or interest in Artisan, I do own shares of two of the Artisan funds (Small Cap Value ARTVX and International Value ARTKX) and have done so since the funds’ inception.

[cr2014]

Zeo Short Duration Income (ZEOIX), July 2014

By David Snowball

At the time of publication of this profile, the fund was named Zeo Strategic Income.

Objective and strategy

Zeo seeks “income and moderate capital appreciation.” They describe themselves as a home for your “strategic cash holdings, with the goals of protecting principal and beating inflation by an attractive margin.” While the prospectus allows a wide range of investments, the core of the portfolio has been short-term high yield bonds, secured floating rate loans and cash. The portfolio is unusually compact for a fixed-income fund. As of June 2014, they had about 30 holdings with 50% of their portfolio in the top ten. Security selection combines top-down quantitative screens with a lot of fundamental research. The advisor consciously manages interest rate, default and currency risks. Their main tool for managing interest rate risk is maintaining a short duration portfolio. It’s typically near a one year duration though might be as high as four in some markets. They have authority to hedge their interest rate exposure but rather prefer the simplicity, transparency and efficiency of simply buying shorter dated securities.

Adviser

Zeo Capital Advisors of San Francisco. Zeo provides investment management services to the fund but also high net worth individuals and family offices through its separately managed accounts. They have about $146 million in assets under management, all relying on some variation of the strategy behind Zeo Strategic Income.

Managers

Venkatesh Reddy and Bradford Cook. Mr. Reddy is the founder of Zeo Capital Advisors and has been the Fund’s lead portfolio manager since inception. Prior to founding Zeo, Mr. Reddy had worked with several hedge funds, including Pine River Capital Management and Laurel Ridge Asset Management which he founded. He was also the “head of delta-one trading, and he structured derivative products as a portfolio manager within Bank of America’s Equity Financial Products group.” As a guy who specialized in risk management and long-tail risk, he was “the guy who put the hedging into the hedge fund.” Mr. Cook’s career started as an auditor for PricewaterhouseCoopers, he moved to Oaktree Capital in 2001 where he served as a vice president on their European high yield fund. He had subsequent stints as head of convertible strategies at Sterne Agee Group and head of credit research in the convertible bond group at Thomas Weisel Partners LLC before joining Zeo in 2012. Mr. Reddy has a Bachelor of Science degree in Computer Science from Harvard University and Mr. Cook earned a Bachelor of Commerce from the University of Calgary.

Strategy capacity and closure

The fund pursues “capacity constrained” strategies; that is, by its nature the fund’s strategy will never accommodate multiple billions of dollars. The advisor doesn’t have a predefined bright line because the capacity changes with market conditions. In general, the strategy might accommodate $500 million – $1 billion.

Management’s stake in the fund

As of the last Statement of Additional Information (April 2013), Mr. Reddy and Mr. Cook each had between $1 – 10,000 invested in the fund. The manager’s commitment is vastly greater than that outdated stat reveals. Effectively all of his personal capital is tied up in the fund or Zeo Capital’s fund operations. None of the fund’s directors had any investment in it. That’s no particular indictment of the fund since the directors had no investment in any of the 98 funds they oversaw.

Opening date

May 31, 2011.

Minimum investment

$5,000 and a 15 minute suitability conversation. The amount is reduced to $1,500 for retirement savings accounts. The minimum for subsequent investments is $1,000. That unusually high threshold likely reflects the fund’s origins as an institutional vehicle. Up until October 2013 the minimum initial investment was $250,000. The fund is available through Fidelity, Schwab, Scottrade, Vanguard and a handful of smaller platforms.

Expense ratio

The reported expense ratio is 1.50% which substantially overstates the expenses current investors are likely to encounter. The 1.50% calculation was done in early 2013 and was based on a very small asset base. With current fund assets of $104 million (as of June 2014), expenses are being spread over a far larger investor pool. This is likely to be updated in the next prospectus.

Comments

ZEOIX exists to help answer a simple question: how do we help investors manage today’s low yield environment without setting them up for failure in tomorrow’s rising rate one? Many managers, driven by the demands of “scalability” and marketing, have generated complex strategies and sprawling portfolios (PIMCO Short Term, for example, has 1500 long positions, 30 shorts and a 250% turnover) in pursuit of an answer. Zeo, freed of both of those pressures, has pursued a simpler, more elegant answer.

The managers look for good businesses that need to borrow capital for relatively short periods at relatively high rates. Their investable universe is somewhere around 3000 issues. They use quantitative screens for creditworthiness and portfolio risk to whittle that down to about 150 investment candidates. They investigate those 150 in-depth to determine the likelihood that, given a wide variety of stressors, they’ll be able to repay their debt and where in the firm’s capital structure the sweet spot lies. They end up with 20-30 positions, some in short-term bonds and some in secured floating-rate loans (for example, a floating rate loan at LIBOR + 2.8% to a distressed borrower secured by the borrower’s substantial inventory of airplane spare parts), plus some cash.

Mr. Reddy has substantial experience in risk management and its evident here.

This is not a glamorous niche and doesn’t promise glamorous returns. The fund returned 3.6% annually over its first three years with essentially zero (-0.01) correlation to the aggregate bond market. Its SMA composite has posted negative returns in six of 60 months but has never lost money in more than two consecutive months (during the 2011 taper tantrum). The fund’s median loss in a down month is 0.30%.

The fund’s Sharpe ratio, the most widely quoted calculation of an investment’s risk/return balance, is 2.35. That’s in the top one-third of one percent of all funds in the Morningstar database. Only 26 of 7250 funds can match or exceed that ratio and just six (including Intrepid Income ICMUX and the closed RiverPark Short Term High Yield RPHYX funds) have generated better returns.

Zeo’s managers, like RiverPark’s, think of the fund as a strategic cash management option; that is, it’s the sort of place where your emergency fund or that fraction of your portfolio that you have chosen to keep permanently in cash might reside. Both managers think of their funds as something appropriate for money that you might need in six months, but neither would be comfortable thinking of it as “a money market on steroids” or any such. Both are intensely risk-alert and have been very clear that they’d far rather protect principal than reach for yield. Nonetheless, some bumps are inevitable. For visual learners, here’s the chart of Zeo’s total returns since inception (blue) charted against RPHYX (orange), the average short-term bond fund (green) and a really good money market fund (Vanguard Prime, the yellow line).

ZEOIX

Bottom Line

All funds pay lip service to the claim “we’re not for everybody.” Zeo means it. Their reluctance to launch a website, their desire to speak directly with you before you invest in the fund and their willingness to turn away large investments (twice of late) when they don’t think they’re a good match with their potential investor’s needs and expectations, all signal an extraordinarily thoughtful relationship between manager and investor. Both their business and investment models are working. Current investors – about a 50/50 mix of advisors and family offices – are both adding to their positions and helping to bring new investors to the fund, both of which are powerful endorsements. Modestly affluent folks who are looking to both finish ahead of inflation and sleep at night should likely make the effort to reach out and learn more.

Fund website

Effectively none. Zeo.com contains the same information you’d find on a business card. (Yeah, I know.) Because most of their investors come through referrals and personal interactions it’s not a really high priority for them. They aspire to a nicely minimalist site at some point in the foreseeable future. Until then you’re best off calling and chatting with them.

Fund Fact Sheet

[cr2014]

Dodge and Cox Global Bond (DODLX), June 2014

By David Snowball

Objective and strategy

DODLX is seeking a high rate of total return consistent with long-term preservation of capital. They’ll invest in both government and corporate securities, including those of firms domiciled in emerging markets. They begin with a set of macro-level judgments about the global economy, currency fluctuation and political conditions in various regions. The security selection process seems wide-ranging. They’re able to hedge currency, interest rate and other risks.

Adviser

Dodge & Cox was founded in 1930, by Van Duyn Dodge and E. Morris Cox. The firm, headquartered in San Francisco, launched its first mutual fund (now called Dodge & Cox Balanced) in 1931 then added four additional funds (Stock, Income, International and Global Stock) over the next 85 years. Dodge & Cox manages around $200 billion, of which $160 billion are in their mutual funds. The remainder is in 800+ separate accounts. Their funds are all low-cost, low-turnover, value-conscious and team-managed.

Managers

Dana Emery, Diana Strandberg, Thomas Dugan, James Dignan, Adam Rubinson, and Lucinda Johns.  They are, collectively, the Global Bond Investment Policy Committee. The fact that the manager bios aren’t mentioned, and then briefly, until page 56 of the prospectus but the SAI lists the brief bio of every investment professional at the firm (down to the assistant treasurer) tells you something about the Dodge culture. In any case, the members have been with D&C for 12 – 31 years and have a combined 116 years with the firm.

Strategy capacity and closure

Unknown, but the firm is prone to large funds. They’re also willing to close those funds and seem to have managed well the balance between performance and assets.

Management’s stake in the fund

Unknown since the fund opened after the reporting data in the SAI. That said, almost every director has a substantial personal investment in almost every fund, and every director (except a recent appointee, who has under $50,000 but has been onboard for just one year) has over $100,000 invested with the firm. Likewise every member of the Investment Committee invests heavily in every D&C; most managers have more than $1 million in each fund. The smallest reported holding is still over $100,000.

Opening date

December 5, 2012 if you count the predecessor fund, a private partnership, or May 1, 2014 if you date it from conversion to a mutual fund.

Minimum investment

$2,500 initial minimum investment, reduced to $1,000 for IRAs.

Expense ratio

0.45% on assets of $1.9 Billion, as of July 2023. 

Comments

Many people assume that the funds managed by venerable “white shoe” firms are automatically timid. They are not. They are frequently value-conscious, risk-conscious, tax-conscious and expense-conscious. They are frequently very fine. But they are not necessarily timid. Welcome to Dodge & Cox, a firm founded during the Great Depression to help the rich remain rich. They are, by all measures, an exemplary institution. Their funds are all run by low-profile teams of long-tenured professionals and they are inclined to avoid contact with the media. Their decision-making is legitimately collective and their performance is consistently admirable. Here’s the argument for owning what Dodge & Cox sells:

Name Ticker Inception M* Ranking M* Analyst Rating M* Expenses
Balanced DODBX 1931 Four star Gold Low
Global Stock DODWX 2008 Four star Gold Low
International Stock DODFX 2001 Four star Gold Low
Income DODIX 1989 Four star Gold Low
Stock DODGX 1965 Four star Gold Low

Here’s the argument against it:

    Assets, in billions Peer rank in 2008 M* risk Great Owl or not MFO Risk Group
Balanced DODBX 15 Bottom 11% High No Above average
Global Stock DODWX 5 n/a Above average No Average
International Stock DODFX 59 Bottom 18% Above Average to High No High
Income DODIX 26 Top third Average No High
Stock DODGX 56 Bottom 9% Above Average No High

The sum of the argument is this: D&C is independent. They have perspectives not shared by the vast majority of their competitors. When they encounter what they believe to be a fundamentally good idea, they move decisively on it. Sometimes their decisive moves are premature, and considerable dislocation can result. Dodge & Cox Global Fund started as a private partnership and documents filed with the SEC suggests that the fund had a single shareholder. As a result, the portfolio could be quite finely tuned to the risk tolerance of its investors. The fund’s current portfolio contains 25.4% emerging markets bonds. It has 14% of its money in Latin American bonds (the average global bond fund has 1%) and 5% in African bonds (versus 1%). 59% of the bond is rated by Moody’s as Baa (lower medium-grade bonds) or lower. Those imply a different risk-return profile than you will find in the average global bond fund. Why worry about a global bond fund at all? Four reasons come to mind:

  1. International bonds now represent the world’s largest asset class: about 32% of the total value of the global stock and bond market, up from 19% of the global market in 2000.

  2. The average American investor has very limited exposure to non-U.S. bonds. Vanguard’s analysis (linked below) concludes “ U.S. investors generally have little, if any, exposure to foreign bonds in their portfolios.”

  3. The average American investor with non-U.S. bond exposure is likely exposed to the wrong bonds. Both index funds and timid managers replicate the mistakes embodied in their indexes: they weight their portfolios by the amount of debt issuance rather than by the quality of issuer. What does that mean? It means that most bond indexes (hence most index and closet-index funds) give the largest weighting to whoever issues the greatest volume of debt, rather than to the issuers who are most capable of repaying that debt promptly and in full.

  4. Adding “the right bonds” to your portfolio will fundamentally improve your portfolio’s risk/return profile. A 2014 Vanguard study on the effects of increasing international bond exposure reaches two conclusions: (1) adding unhedged international bonds increases volatility without offsetting increase in returns because it represents a simple currency bet but (2) adding currency-hedged international bond exposure decreases volatility in almost all portfolios. They report:

    It is interesting that, once the currency risk is removed through hedging, the least-volatile portfolio is 42% U.S. stocks, 18% international stocks, and 40% international bonds. Further, with bond currency risk negated, the inclusion of international bonds has relatively little effect on the allocation decision regarding international stocks. In other words, a 30% allocation to international stocks within the equity portion of the portfolio (18% divided by 60%) remains optimal for reducing volatility over the period analyzed, regardless of the level of international bond allocation.

    This makes it easier for investors to assess the impact of adding international bonds to a portfolio. In addition, we find that hedged international bonds historically have offered consistent risk-reduction benefits: Portfolio volatility decreases with each incremental allocation to international bonds.

    The greatest positive effect they found was from the addition of emerging markets bonds.

Bottom Line

The odds favor the following statement: DODLX will be a very solid long-term core holding. The managers’ independence from the market, but dependence on D&C’s group culture, will occasionally blow up. If you check your portfolio only once every three-to-five years, you’ll be very satisfied with D&C’s stewardship of your money.

Fund website

Dodge & Cox Global Bond Fund. For those interested in working through the details of the D&C Global Bond Fund L.L.C., the audited financials are available through the SEC archive. [cr2014]

Guinness Atkinson Dividend Builder (GAINX), March 2014

By David Snowball

*This fund has been converted into an ETF (February 2021)*

Objective and Strategy

Guinness Atkinson Inflation Managed Dividend seeks consistent dividend growth at a rate greater than the rate of inflation by investing in a global portfolio of about 30 dividend paying stocks. Stocks in the portfolio have survived four screens, one for business quality and three for valuation. They are:

  1. They first identify dividend-paying companies that have provided an inflation-adjusted cash flow return on investment of at least 10% in each of the last 10 years. (That process reduces the potential field from 14,000 companies to about 400.) That’s the “10 over 10” strategy that they refer to often.
  2. They screen for companies with at least a moderate dividend yield, a history of rising dividends, low levels of debt and a low payout ratio.
  3. They do rigorous fundamental analysis of each firm, including reflections on macro issues and the state of the company’s business.
  4. They invest in the 35 most attractively valued stocks that survived those screens and weight each equally in the portfolio.

Active share is a measure of a portfolio’s independence, the degree to which is differs from its benchmark. In general, for a fund with a large cap bias, a value above 70 is desirable. The most recent calculation (February 2014) places this fund’s active share at 92.

Adviser

Guinness Atkinson Asset Management. The firm started in 1993 as the US arm of Guinness Flight Global Asset Management and their first American funds were Guinness Flight China and Hong Kong (1994) and Asia Focus (1996). Guinness Flight was acquired by Investec, then Tim Guinness and Jim Atkinson’s acquired Investec’s US funds business to form Guinness Atkinson. Their London-based sister company is Guinness Asset Management which runs European funds that parallel the U.S. ones. The U.S. operation has about $375 million in assets under management and advises the eight GA funds.

Manager

Ian Mortimer and Matthew Page. Dr. Mortimer joined GA in 2006 and also co-manages the Global Innovators (IWIRX) fund. Prior to joining GA, he completed a doctorate in experimental physics at the University of Oxford. Mr. Page joined GA in 2005 and working for Goldman Sachs. He earned an M.A. from Oxford in 2004. The guys also co-manage European versions of their funds including the Dublin-based version of this one, called Guinness Global Equity Income.

Strategy capacity and closure

About $1 billion. The smallest stock the fund will invest in is about $1 billion. With a compact, equal-weighted portfolio, having much more than $1 billion in the strategy would impede their ability to invest in their smallest targeted names.

Management’s stake in the fund

It’s a little complicated. The managers, both residents of England, do not own shares of the American version of the fund but both do own shares of the European version. That provides the same portfolio, but a different legal structure and far better tax treatment. Matt avers “it’s most of my pension pot.” Corporately Guinness Atkinson has about $180,000 invested in the fund and, separately, President Jim Atkinson appears to be the fund’s largest shareholder

Opening date

March 30, 2012. The European version of the fund is about a year older.

Minimum investment

$10,000, reduced to $5,000 for IRAs. There are lower minimums at some brokerages. Schwab, for example, has the fund NTF for $2500 for regular accounts and $1000 for IRAs. Fidelity requires $2500 for either sort of account.

Expense ratio

0.68% on assets of $3 million (as of February 2014). That’s competitive with the ETFs in the same space and lower than the ETNs.

Comments

There are, in general, two flavors of value investing: buy cigar butts on the cheap (wretched companies whose stocks more than discount their misery) or buy great companies at good prices. GAINX is firmly in the latter camp. Many investors share their enthusiasm for the sorts of great firms that Morningstar designates as having “wide moats.”

The question is: how can we best determine what qualifies as a “great company”? Most investors, Morningstar included, rely on a series of qualitative judgments about the quality of management, entry barriers, irreproducible niches and so on. Messrs. Mortimer and Page start with a simpler, more objective premise: great companies consistently produce great results. They believe the best measurement of “great results” is high and consistent cash flow return on investment (CFROI). In its simplest terms, CFROI asks “when a firm invests, say, a million dollars, how much additional cash flow does that investment create?” Crafty managers like cash flow calculations because they’re harder for firms to manipulate than are the many flavors of earnings. One proof of its validity is the fact that a firm’s own management will generally use CFROI – often called the internal rate of return – to determine whether a project, expansion or acquisition is worth undertaking. If you invest a million and get $10,000 in cash flows the first year, your CFROI is 1%. At that rate, it would take the firm a century to recoup its investment.

The GAINX managers set a high and objective initial bar: firms must be paying a dividend and must have a CFROI greater than 10% in each of the past 10 years. Only about 3% of all publicly-traded companies clear that hurdle. Cyclical firms whose fortunes soar and dive disappear from the pool, as well as many utilities and telecomm firms whose “excess” returns get regulated away. More importantly, they screen out firms whose management do not consistently and substantially add demonstrable value. That 3% are, by their standards, great companies.

One important signal that they’ve found a valid measure of a firm’s quality is the stability of the list. About 95% of the stocks that qualify this year will qualify next year as well, and about 80% will continue to qualify four years hence. This helps contribute to the fund’s very low turnover rate, 13%.

Because such firms tend to see their stocks bid up, the guys then apply a series of valuation and financial stability screens as well as fundamental analyses of the firm’s industry and challenges. In the end they select the 30-35 most attractively valued names in their pool. That value-consciousness led them to add defense contractors when they hit 10 year valuation lows in the midst of rumors of defense cutbacks and H&R Block when the specter of tax simplification loomed. Overall, the portfolio sells at about a 9% discount to the MSCI World index despite holding higher-quality firms.

The fund has done well since inception: from inception through December 30, 2013, $10,000 in GAINX would have grown to $13,600 versus $12,900 in its average global stock peer. In that same period the fund outperformed its peers in five of six months when the peer group lost money.

The fund underperformed in the first two months of 2014 for a surprising reason: volatility in the emerging markets. While the fund owns very few firms domiciled in the emerging markets, about 25% of the total revenues of all of their portfolios firms are generated in the emerging markets. That’s a powerful source of long-term growth but also a palpable drag during short-term panics; in particular, top holding Aberdeen Asset Management took a huge hit in January because of the performance of their emerging markets investments.

Bottom Line

The fund strives for two things: investments in great firms and a moderate, growing income stream (current 2.9%) that might help investors in a yield-starved world. Their selection criteria strike us as distinctive, objective, rigorous and reasonable, giving them structural advantages over both passive products and the great majority of their active-managed peers. While no investment thrives in every market, this one has the hallmarks of an exceptional, long-term holding. Investors worried about the fund’s tiny U.S. asset base should take comfort from the fact that the strategy is actually around $80 million when you account for the fund’s Dublin-domiciled version.

Fund website

Guinness Atkinson Inflation-Managed Dividend. Folks interested in the underlying strategy might want to read their white paper, 10 over 10 Investment Strategy. The managers offered a really nice portfolio update, in February 2014, for their European investors.

[cr2014]

Driehaus Emerging Markets Small Cap Growth Fund (DRESX), March, 2014

By David Snowball

Objective and strategy

Driehaus Emerging Markets Small Cap Growth Fund seeks superior risk-adjusted returns over full market cycles relative to those of the MSCI Emerging Markets Small Cap Index. The managers combine about 100 small cap names with an actively-managed portfolio hedge. They create the hedge by purchasing sector, country, or broad market index options, generally. 

Adviser

Driehaus Capital Management is a privately-held investment management firm based in Chicago.  They have about $12 billion in assets under management as of January 31, 2014. The firm manages five broad sets of strategies (global, emerging markets, and U.S. growth equity, hedged equity, and alternative investment) for a global collection of institutional investors, family offices, and financial advisors. Driehaus also advises the 10 Driehaus funds which have about $8 billion in assets between them, more than half of that in Driehaus Active Income (LCMAX, closed) and 90% in three funds (LCMAX, Driehaus Select Credit DRSLX, also closed and Driehaus Emerging Markets Growth DREGX).

Managers

Chad Cleaver and Howard Schwab. Mr. Cleaver is the lead manager on this fund and co-manager for the Emerging Markets Growth strategy. He’s responsible for the strategy’s portfolio construction and buy/sell decisions. He began his career with the Board of Governors of the Federal Reserve System and joined Driehaus Capital Management in 2004.  Mr. Schwab is the lead portfolio manager for the Emerging Markets Growth strategy and co-manager here and with the International Small Cap Growth strategy. In his role as lead portfolio manager, Mr. Schwab is responsible for the strategy’s portfolio construction. As co-manager he oversees the research team and evaluates investment ideas. He is also involved in analyzing macro-level trends and associated market risks. Mr. Schwab joined Driehaus Capital Management in 2001. Both of the managers have undergraduate degrees from strong liberal arts colleges, as well as the requisite graduate degrees and certifications.

Strategy capacity and closure

Between $600 – 800 million, at which point the firm would soft-close the fund as they’ve done to several others. DRESX is the only manifestation of the strategy.

Active Share

Active share is a measure of a portfolio’s independence, the degree to which is differs from its benchmark. The combination of agnosticism about their benchmark, fundamental security selection that often identifies out-of-index names and their calls typically results in a high active share. The most recent calculation (February 2014) places it at 96.4.

Management’s stake in the fund

Each of the managers has invested between $100,000 and $500,000 in the fund. They have a comparable amount invested in the Emerging Markets Growth Fund (DREGX), which they also co-manage. As of March 2013, insiders own 23% of the fund shares, including 8.4% held by the Driehaus Family Partnership.

Opening date

The fund began life on December 1, 2008 as Driehaus Emerging Markets Small Cap Growth Fund, L.P. It converted to a mutual fund on August 22, 2011.

Minimum investment

$10,000, reduced to $2000 for IRAs.

Expense ratio

1.25%, after waivers, on assets of $109.5 million (as of July 2023). 

Comments

Emerging markets small cap stocks are underappreciated. The common stereotype is just like other emerging markets stocks, only more so: more growth, more volatility, more thrills, more chills.

That stereotype is wrong. Stock ownership derives value from the call it gives you on a firm’s earnings, and the characteristic of EM small cap earnings are fundamentally and substantially different from those of larger EM firms. In particular, EM small caps represent, or offer:

Different countries: not all countries are equally amenable to entrepreneurship. In Russia, for instance, 60% of the market capitalization is in just five large firms. In Brazil, it’s closer to 25%.

Different sectors: small caps are generally not in sectors that require huge capital outlays or provide large economies of scale. They’re substantially underrepresented in the energy and telecom sectors but overrepresented in manufacturing, consumer stocks and health care.

More local exposure: the small cap sectors tend to be driven by relatively local demand and conditions, rather than global macro-factors. On whole EM small caps derive about 24% of their earnings from international markets (including their immediate neighbors) while EM large caps have a 50% greater exposure. As a result, about 20% of the volatility in global cap small stocks is explained by macro factors, compared to 33% for all global stocks.

Higher dividends: EM small caps, as a group, pay about 3.2% while large caps pay 3.0%.

Greater insider ownership: about 44% of the stock for EM small caps is held by corporate insiders against 34% for larger EM stocks. The more important question might be who doesn’t own EM small caps. “State-owned enterprises” are more commonly larger firms whose financial decisions may be driven more by the government’s needs than the private investors’.  Only 2% of the stock of EM small caps is owned by local governments.

Historically higher returns: from 2001-2013, EM small caps returned 12.7% annually versus 11.1% for EM large caps and 3.7% for US large caps.

But, oddly, slower growth (11.2% EPS growth versus 12.2% for all EM) and comparable volatility (26.1 SD versus 24.4 for large caps).

The data understates the magnitude of those differences because of biases built into EM indexes.  Those indexes are created to support exchange-traded and other passive investment products (no one builds indexes just for the heck of it). In order to be useful, they have to be built to support massive, rapid trades so that if a hedge fund wants to plunk a couple hundred million into EM small caps this morning and get back out in the afternoon, it can. To accommodate that, indexes build in liquidity, scalability and tradeability screens. That means indexes (hence ETFs) exclude about 600 publicly-traded EM small caps – about 25% of that universe – and those microcap names are among the firms least like the larger-cap indexes.

The downfall of EM small caps comes as a result of liquidity crises: street protests in Turkey, a corporate failure in Mexico, a somber statement by a bank in Malaysia and suddenly institutional investors are dumping baskets of stocks, driving down the good with the bad and driving small stocks down most of all. Templeton Emerging Markets Small Cap (TEMMX), for example, lost 66% of its value during the 2007-09 crash.

Driehaus thinks it has a way to harness the substantial and intriguing potential of EM small caps while buffering a chunk of the downside risk. Their strategy has two elements.

They construct a long portfolio of about 100 stocks.  In general they’re looking for firms at “growth inflection points.”  The translation is stocks where a change in the price trend is foreseeable. They often draw on insights from behavioral finance to identify securities mispriced because of investor biases in reacting to changes in the magnitude, acceleration or duration of growth prospects.

They hedge the portfolio with options. They call purchase or write options on ETFs, or short ETFs when no option is available. The extent of the hedge varies with market conditions; a 10-40% hedge would be in the normal range. In general they attempt to hedge country, sector and market risk. They can use options strategies offensively but mostly they’re for defense.

The available evidence suggests their strategy works well. Really well.  Really, really well.  Over the past three years (through 12/30/13), the fund has excelled in all of the standard risk metrics when benchmarked against the MSCI Emerging Markets Small Cap Index.


Driehaus

MSCI EM Small Cap

Beta

0.73

1.00

Standard deviation

16.2

19.1

Downside deviation

11.9

15.0

Downside capture

56.4%

100%

# negative months

11

18

The strategy of winning-by-not-losing has been vastly profitable over the past three, volatile years.  Between January 2011 – December 2013, DRESX returned 7.4% annually while its EM small cap peers lost 3.2% and EM stocks overall dropped 1.7% annually.

The universal question is, “but aren’t there cheaper, passive alternatives?”  There are four or five EM small cap ETFs.  They are, on whole, inferior to Driehaus. While they boast lower expenses, they’re marred by inferior portfolios designed for tradeability rather than value, and inferior performance.  Here’s the past three years of DRESX (the blue line) and the SPDR, WisdomTree and iShares ETFs:

dresx chart

Bottom Line

For long-term investors, substantial emerging markets exposure makes sense. Actively managing that investment to avoid the substantial, inherent biases which afflict EM indexes, and the passive products built around them, makes sense. In general, that means that the most attractive corner of the EM universe – measured by both fundamentals and diversification value – are smaller cap stocks.  There are only 18 funds oriented to small- and mid-cap EM stocks and just seven true small caps.  Driehaus’s careful portfolio construction and effective hedging should put them high on any EM investor’s due diligence list. They’ve done really first-rate work. 

Fund website

The Driehaus Emerging Markets Small Cap Growth homepage links to an embarrassing richness of information on the fund, its portfolio and its performance. The country-by-country attribution tables are, for the average investor, probably a bit much but the statistical information is unmatched.

Much of the information on EM small caps as a group was presented in two MSCI research papers, “Adding Global Small Caps: The New Investable Equity Opportunity Set?” (October 2012) and “Small Caps – No Small Oversight: Institutional Investors and Global Small Cap Equities” (March 2012). Both are available from MSCI but require free registration and I felt it unfair to link directly to them. In addition, Advisory Research has a nice summary of the EM small cap distinctions in a short marketing piece entitled “Investing in value oriented emerging market small cap and mid cap equities” (October 2013). 

[cr2014]

Grandeur Peak Emerging Markets Opportunities (formerly Grandeur Peak Emerging Opportunities), (GPEOX), February 2014

By David Snowball

At the time of publication, this fund was named Grandeur Peak Emerging Opportunities.

Objective and Strategy

Emerging Opportunities pursues long-term capital growth primarily by investing in a small and micro-cap portfolio of emerging and, to a lesser extent, frontier market stocks. Up to 90% of the fund might normally be invested in microcaps (stocks with market cap under $1 billion at the time of purchase), but they’re also allowed to invest up to 35% in stocks over $5 billion. The managers seek high quality companies that they place in one of three classifications:

Best-In-Class Growth Companies: fast earnings growth, good management, strong financials. The strategy is to “find them small and undiscovered; buy and hold” until the market catches on. In the interim, capture the compounded earnings growth.

Fallen Angels: good growth companies that hit “a bump in the road” and are priced as value stocks. The strategy is to buy them low and hold through the recovery.

Stalwarts: basically, blue chip mid-cap stocks. Decent but not great growth, great financials, and the prospect of dividends or stock buy-backs. The strategy is to buy them at a fair price, but be careful of overpaying since their growth may be decelerating.

The stocks in GPEOX represent the emerging and frontier stocks in the flagship Grandeur Peak Global Reach (GPROX) portfolio.

Adviser

Grandeur Peak Global Advisors is a small- and micro-cap focused global equities investment firm, founded in mid-2011, and comprised of a very experienced and collaborative investment team that worked together for years managing some of the Wasatch funds. They advise four Grandeur Peak funds and one “pooled investment vehicle.” The adviser passed $1 billion in assets under management in July, 2013.

Managers

Blake Walker and Spencer Stewart, benignly overseen by Robert Gardiner. Blake Walker is co-founder of and Chief Investment Officer for Grandeur Peak. Mr. Walker was a portfolio manager for two funds at Wasatch Advisors. Mr. Walker joined the research team at Wasatch Advisors in 2001 and launched his first fund, the Wasatch International Opportunities Fund (WAIOX) in 2005. He teamed up with Mr. Gardiner in 2008 to launch the Wasatch Global Opportunities (WAGOX). Mr. Stewart has been a senior research analyst at Grandeur Peak Global Advisors since 2011. He joined Grandeur Peak from Sidoti & Company, a small-cap boutique in New York and had previously worked at Wasatch, which his father founded. Mr. Gardiner is designated as an “Advising Manager,” which positions him to offer oversight and strategy without being the day-to-day guy. Prior to founding Grandeur Peak, he managed or co-managed Wasatch Microcap (WMICX), Small Cap Value (WMCVX) and Microcap Value (WAMVX, in which I own shares). They’re supported by four Senior Research Associates.

Strategy capacity and closure

$200 million. Grandeur Peak specializes in global small and micro-cap investing. Their estimate, given current conditions, is that they could effectively manage about $3 billion in assets. They could imagine running seven distinct small- to micro-cap funds and close all of them (likely a soft close) when the firm’s assets under management reach about $2 billion. The adviser has target closure levels for each current and planned fund.

Management’s stake in the fund

None yet disclosed, but the Grandeur Peak folks tend to invest heavily in their funds.

Opening date

December 16, 2013.

Minimum investment

$2,000, reduced to $1,000 for an account established with an automatic investment plan.

Expense ratio

1.78% for Investor class shares on assets of $452 million, as of July 2023. 

Comments

There’s little to be said about Emerging Opportunities but much to be said for it.

Grandeur Peak operates a single master profile, which is offered to the public through their Global Reach fund. The other current and pending Grandeur Peak funds are essentially just subsets of that portfolio. Emerging Opportunities are the EM and frontier stocks from that portfolio. While there are 178 diversified emerging markets funds, only 18 invest primarily in small- and mid-cap stocks. Of the 18 smid-cap funds, only two end up in Morningstar’s “small cap” style box (Templeton Emerging Markets Small Cap TEMMX is the other). Of the two true EM small caps, only one will give you significant exposure to both small and micro-cap stocks (TEMMX, still open with a half billion in assets, higher expenses and a front-load, is 14% microcap while GPEOX is 44% microcap).

That’s what we can say about GPEOX. What we can say for it is this: the fund is managed by one of the most experienced, distinguished and consistently successful small cap teams around. The general picture of investing with Grandeur Peak looks rather like this:

GPGOX snip

In general, past performance is a rotten way of selecting an investment. When that performance is generated consistently, across decades, categories and funds, by the same team, it strikes me as rather more important.

Their investable universe is about 30,000 publicly-traded stocks, most particularly small and microcap, from around the globe, many with little external analyst coverage. The plan is for Global Reach to function as a sort of master portfolio, holding all of the stocks that the firm finds, at any given point, to be compelling. They estimate that that will be somewhere between 300 and 500 names. Those stocks will be selected based on the same criteria that drove portfolio construction at Global Opportunities and International Opportunities and at the Wasatch funds before them. Those selection criteria drive Grandeur Peak to seek out high quality small companies with a strong bias toward microcap stocks. This has traditionally been a distinctive niche and a highly rewarding one. Each of their three earlier funds boasts their categories’ the smallest market caps by far and, in first 30 months of existence, some of their category’s strongest returns. The pattern seems likely to repeat.

Are there reasons for concern? Three come to mind.

The characteristics of the market are largely unknown. In general, EM small caps offer greater growth prospects, less efficient pricing and greater diversification benefits than do other EM stocks. The companies’ prospects are often more tied to local economies and less dependent on commodity exports to the developed world. The three ETFs investing in such stocks have had solid to spectacular relative performance. That said, there’s a very limited public track record for portfolios of such stocks, with the oldest ETF being just five years old and the only active fund being seven years old. Investing here represents an act of faith as much as a rational calculation.

Managing seven funds could, eventually, stretch the managers’ resources. Cutting against this is the unique relationship of Global Reach to its sister portfolios. The great bulk of the research effort will manifest itself in the Global Reach portfolio; the remaining funds will remain subsidiary to it. That is, they will represent slices of the larger portfolio, not distinct burdens in addition to it.

The fund’s expense ratios are structurally, persistently high. The fund will charge 1.95%, below the fees for many EM smid caps, but substantially above the 1.60% charged by the average no-load EM fund. The management fee alone is 1.35%. Cutting against that, of course, is the fact that Mr. Gardiner has for nearly three decades now, more than earned the fees assessed to his investors. It appears that you’re getting more than what you are paying for; while the fee is substantial, it seems to be well-earned.

Bottom Line

This is a very young, but very promising fund. It is also tightly capacity constrained, so that it is likely to close early in 2014 despite Grandeur Peak’s decision not to publicize the fund at launch. For investors interested in a portfolio of high-quality, growth-oriented stocks from the fastest growing markets, there are few more-attractive opportunities available.

Fund website

Grandeur Peak Emerging Opportunities

Disclosure

By way of disclosure, while the Observer has no financial relationship with or interest in Grandeur Peak, I do own shares of GPEOX in my Roth IRA, along with shares of Wasatch Microcap Value (WAMVX) which Mr. Gardiner once managed.

[cr2014]

RiverPark Strategic Income Fund (RSIVX), January 2014

By David Snowball

Objective and strategy

The fund is seeking high current income and capital appreciation consistent with the preservation of capital. The manager does not seek the highest available return.  He’s pursuing 7-8% annual returns but he will not “reach for returns” at the risk of loss of capital.  The portfolio will generally contain 30-40 fixed income securities, all designated as “money good” but the majority also categorized as high-yield.  There will be limited exposure to corporate debt in other developed nations and no direct exposure to emerging markets.  While the manager has the freedom to invest in equities, they are unlikely ever to occupy a noticeable slice of the portfolio. 

Adviser

RiverPark Advisors, LLC.   RiverPark was formed in 2009 by former executives of Baron Asset Management.  The firm is privately owned, with 84% of the company being owned by its employees.  They advise, directly or through the selection of sub-advisers, the seven RiverPark funds.

Manager

David K. Sherman, president and founder of the subadvisor, Cohanzick Management, LLC. Mr. Sherman founded Cohanzick in 1996 after a decade spent in various director and executive positions with Leucadia National Corporation. Mr. Sherman has a B.S. in Business Administration from Washington University and an odd affection for the Philadelphia Eagles. He is also the manager of the recently soft-closed RiverPark Short Term High Yield Fund (RPHYX).

Strategy capacity and closure

The strategy has a capacity of about $2 billion but its execution requires that the fund remain “nimble and small.”  As a result, management will consider asset levels and fund flows carefully as they move in the vicinity of their cap.

Management’s stake in the fund

Collectively the professionals at RiverPark and Cohanzick have invested more than $3 million in the fund, including $2.5 million in “seed money” from Mr. Sherman and RiverPark’s president, Morty Schaja. Both men are increasing their investment in the fund with a combination of “new money” and funds rebalanced from other investments.

Opening date

September 30, 2013

Minimum investment

$1,000 minimum initial investment for retail shares. There is no minimum for subsequent investments if payment is mailed by check; otherwise the minimum is $100.

Expense ratio

1.25% after waivers of 0.40% on assets of $116 million (as of December, 2013).

Comments

RiverPark Strategic Income has a simple philosophy, an understandable strategy and a hard-to-explain portfolio.  The combination is, frankly, pretty compelling.

The philosophy: don’t get greedy.  After a quarter century of researching and investing in distressed, high-yield and special situations fixed income securities, Mr. Sherman has concluded that he can either make 7% with minimal risk of permanent loss, or he could shoot for substantially higher returns at the risk of losing your money.  He has consistently and adamantly chosen the former.

The strategy: invest in “money good” fixed-income securities.  “Money good” securities are where the manager is very sure (very, very sure) that he’s going to get 100% of his principal and interest back, no matter what happens.  That means 100% if the market tanks.  And it means a bit more than 100% if the issuer goes bankrupt, since he’ll invest in companies whose assets are sufficient that, even in bankruptcy, creditors will eventually receive their principal plus their interest plus their interest on their interest.

Such securities take a fair amount of time to ferret out and might occur in relatively limited quantities, so that some of the biggest funds simply cannot pursue them.  But, once found, they generate an annuity-like stream of income for the fund regardless of market conditions.

The portfolio: in general, the fund is apt to dwell somewhere near the border of short- and intermediate-term bonds.  The fact that shorter duration bonds became the investment du jour for many anxious investors in 2013 meant that they were bid up to unreasonable levels, and Mr. Sherman found greater value in 3- to 5-year issues.

The manager has a great deal of flexibility in investing the fund’s assets and often finds “orphaned” issues or other special situations which are difficult to classify.  As he and RiverPark’s president, Morty Schaja, reflected on the composition of the portfolio, they imagined six broad categories that might help investors better understand what the fund owns.  They are:

  1. Short Term High Yield overlap – securities that are also holdings in the RiverPark Short Term High Yield Fund.
  2. Buy and hold – securities that hold limited credit risk, provide above market yields and might reasonably be held to redemption.
  3. Priority-based – securities from issuers who are in distress, but which would be paid off in full even if the issue were to go bankrupt.  Most investors would instinctively avoid such issues but Mr. Sherman argues that they’re often priced at a discount and are sufficiently senior in the capital structure that they’re safe so long as an investor is willing to wait out the bankruptcy process in exchange for receiving full recompense. An investor can, he says, “get paid a lot of money for your willingness to go through the process.” Cohanzick calls these investments “above-the-fray securities of dented credits”.
  4. Off the beaten path – securities that are not widely-followed and/or are less liquid. These might well be issues too small or too inconvenient for a manager responsible for billions or tens of billions of assets, but attractive to a smaller fund.
  5. Rate expectations – securities that present opportunities because of rising or falling interest rates.  This category would include traditional floating rate securities and opportunities that present themselves because of a difference between a security’s yield to maturity and yield to worst.
  6. Other – which is all of the … other stuff.

Fixed-income investing shouldn’t be exciting.  It should allow you to sleep at night, knowing that your principal is safe and that you’re earning a real return – something greater than the rate of inflation.  Few fixed-income funds lately have met those two expectations and the next few years are not likely to be kind to traditional fixed-income funds.  RiverPark’s combination of opportunism and conservatism, illustrated in the return graph below, offer a rare and appealing combination.

rsivx

Bottom Line

In all honesty, about 80% of all mutual funds could shut their doors today and not be missed.  They thrive by never being bad enough to dump, nominally active funds whose strategy and portfolio are barely distinguishable from an index. The mission of the Observer is to help identify the small, thoughtful, disciplined, active funds whose existence actually matters.

David Sherman runs such funds. His strategies are labor-intensive, consistent, thoughtful, disciplined and profitable.  He has a clear commitment to performance over asset gathering, and to caution over impulse.  Folks navigating the question “what makes sense in fixed-income investing these days?”  owe it to themselves to learn more about RSIVX.

Fund website

RiverPark Funds

RiverPark Strategic Income Fund

Fact Sheet

Disclosure

While the Observer has neither a stake in nor a business relationship with either RiverPark or Cohanzick, both individual members of the Observer staff and the Observer collectively have invested in RPHYX and/or RSIVX.

[cr2014]

T. Rowe Price Global Allocation (RPGAX), December 2013

By David Snowball

Objective and Strategy

The fund’s objective is to seek long-term capital appreciation and income by investing in a broadly diversified global portfolio of investments, including U.S. and international stocks, bonds, and alternative investments.  The plan is to add alpha through a combination of active asset allocation and individual security selection.  Under normal conditions, the fund’s portfolio will consist of approximately 60% stocks; 30% bonds and cash; and 10% alternative investments.  Both the equity and fixed-income sleeves will have significant non-U.S. exposure.

Adviser

T. Rowe Price. Price was founded in 1937 by Thomas Rowe Price, widely acknowledged as “the father of growth investing.” The firm now serves retail and institutional clients through more than 450 separate and commingled institutional accounts and more than 90 stock, bond, and money market funds. As of September 2013, the firm managed approximately $650 billion for more than 11 million individual and institutional investor accounts.

Manager

Charles M. Shriver, who technically heads the fund’s Investment Advisory Committee.  As the chair he has day-to-day responsibility for managing the fund’s portfolio and works with the other fund managers on the committee to develop the fund’s investment program. Mr. Shriver joined Price in 1991 and began working as an investment professional in 1999.  In May 2011 he became the lead manager for Price’s Balanced, Personal Strategy and Spectrum Funds (except for Spectrum International, which he picked up in May 2012).  Stefan Hubrich, Price’s director of asset allocation research, will act as the associate manager.

Strategy capacity and closure

Given the breadth of the fund’s investment universe (all publicly-traded securities worldwide plus a multi-strategy hedge), Price believes there’s no set limit.  They do emphasize their documented willingness to close funds when either the size of the fund or the rate of inflows makes the strategy unmanageable.

Management’s Stake in the Fund

Not yet available.  Mr. Schriver has a total investment of between $500,000 and $1,000,000 in the other funds he helps manage.

Opening date

May 28, 2013.

Minimum investment

$2,500, reduced to $1,000 for IRAs.

Expense ratio

0.87% on assets of $1 Billion, as of July 2023.  

Comments

It’s no secret that the investing world is unstable, now more than usual. Governments, corporations and individuals in the developed world are deeply and systemically in debt. There’s anxiety about the consequences of the Fed’s inevitable end of their easy-money policy; one estimate suggests that a one percentage point rise in the interest rate could cost investors nearly $2.5 trillion.  Analysts foresee the end of the 30 year bull market in bonds, with some predicting 20 lean years and others forecasting The Great Rotation into income-producing equity.  The great drivers of economic growth in the developed world seem to be lagging, China might be restructuring and the global climate is destabilizing with, literally, incalculable results.

Where, in the midst of all that, does opportunity lie?

One answer to the question, “what should you do when you don’t know what to do?” is “do nothing.”  The other answer is “try a bit of everything!”  RPGAX represents an attempt at the latter.

This is designed to be Price’s most flexible, broadly diversified fund.  Its strategic design incorporates nearly 20 asset classes and strategies.  Those will include, including:

  • both large and small-cap domestic and developed international equities
  • both value and growth global equities
  • emerging market equities
  • international bonds
  • short-duration TIPS
  • high yield, floating rate
  • emerging market local currency bonds
  • a multi-strategy hedge fund or two.

Beyond that, they can engage in currency hedging and index call writing to manage risk and generate income that’s uncorrelated to the stock and bond markets.

In short: a bit of everything with a side of hedging, please.

This fund is expected to have a risk profile akin to a balanced portfolio made up of 60% stocks and 40% bonds.

It’s entirely likely that the fund will succeed.  Price has a very good record in assembling asset allocation products.  T. Rowe Price Retirement series, for instance, is recognized as one of the industry’s best, most thoughtful options.  Where other firms started with off-the-cuff estimations of appropriation asset mixes, Price started by actually researching how people lived in retirement and built their funds backward from there.

Their research suggested we spent more in retirement than we anticipate and risk outliving their savings. As a result, they increased both the amount of equity exposure at each turning point and also the exposure to risky sub-classes.  So it wasn’t just “more equity,” it will “more international small cap.”  Both that careful design and the fund’s subsequent performance earned the series of “Gold” rating from Morningstar. 

In 2013 they realized that some investors weren’t comfortable with the extent of equity exposure, and created an entirely separate set of retirement funds with a milder risk profile.  That sort of research and vigilance permeates Price’s culture.

It’s also reflected in the performance of the other funds that Mr. Shriver manages.  They share three characteristics: they are carefully designed, that are uniformly solid and dependable, but they are not designed as low risk funds. 

Morningstar’s current star ratings illustrate the second point:

Star rating:

3 Year

5 Year

10 Year

Overall

Balanced RPBAX

4

4

4

4

Personal Strategy Balanced TRPBX

4

4

4

4

Personal Strategy Growth TRSGX

5

5

4

5

Personal Strategy Income PRSIX

4

4

4

4

Spectrum Growth PRSGX

3

3

4

3

Spectrum Income RPSIX

3

3

3

3

Spectrum International PSILX

3

4

4

4

At the same time, the funds’10 year risks are sometimes just average (Spectrum Income) but mostly above average (Balanced, Personal Strategy Balanced, Personal Strategy Income, Spectrum Growth, Spectrum International).  But never “high.”  That’s not the Price way.

Bottom Line

Investors who have traditionally favored a simple 60/40 hybrid approach and long-term investors who are simply baffled by where to move next should look carefully at RPGAX.  It doesn’t pretend to be a magic bullet, but it offers incredibly broad asset exposure, a modest degree of opportunism and a fair dose of risk hedging in a single, affordable package.  In a fund category marked by high expenses, opaque strategies and untested management teams, it’s apt to stand modestly out.

Fund website

T. Rowe Price Global Allocation

[cr2013]